EasyJet 2009 Annual Report Download - page 5
Download and view the complete annual report
Please find page 5 of the 2009 EasyJet annual report below. You can navigate through the pages in the report by either clicking on the pages listed below, or by using the keyword search tool below to find specific information within the annual report.-
 1
1 -
 2
2 -
 3
3 -
 4
4 -
 5
5 -
 6
6 -
 7
7 -
 8
8 -
 9
9 -
 10
10 -
 11
11 -
 12
12 -
 13
13 -
 14
14 -
 15
15 -
 16
16 -
17
-
18
-
19
-
20
-
21
-
22
-
23
-
24
-
25
-
26
-
27
-
28
-
29
-
30
-
31
-
32
-
33
-
34
-
35
-
36
-
37
-
38
-
39
-
40
-
41
-
42
-
43
-
44
-
45
-
46
-
47
-
48
-
49
-
50
-
51
-
52
-
53
-
54
-
55
-
56
-
57
-
58
-
59
-
60
-
61
-
62
-
63
-
64
-
65
-
66
-
67
-
68
-
69
-
70
-
71
-
72
-
73
-
74
-
75
-
76
-
77
-
78
-
79
-
80
-
81
-
82
-
83
-
84
-
85
-
86
-
87
-
88
-
89
-
90
-
91
-
92
-
93
-
94
-
95
-
96
 |
 |
Annual report and accounts 200903 easyJet plc
qOverview
Business review
Governance
Accounts
Other information
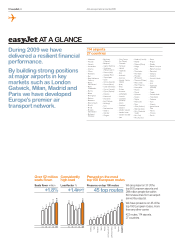
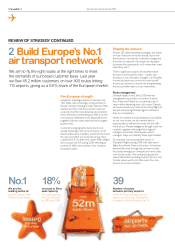
6.5% market share.
45 million passengers.
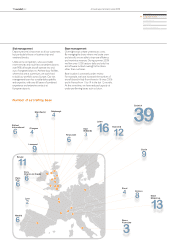
181 aircraft situated in 20 bases.
50% of passengers originate
outside the UK.
Focused on European
short-haul aviation
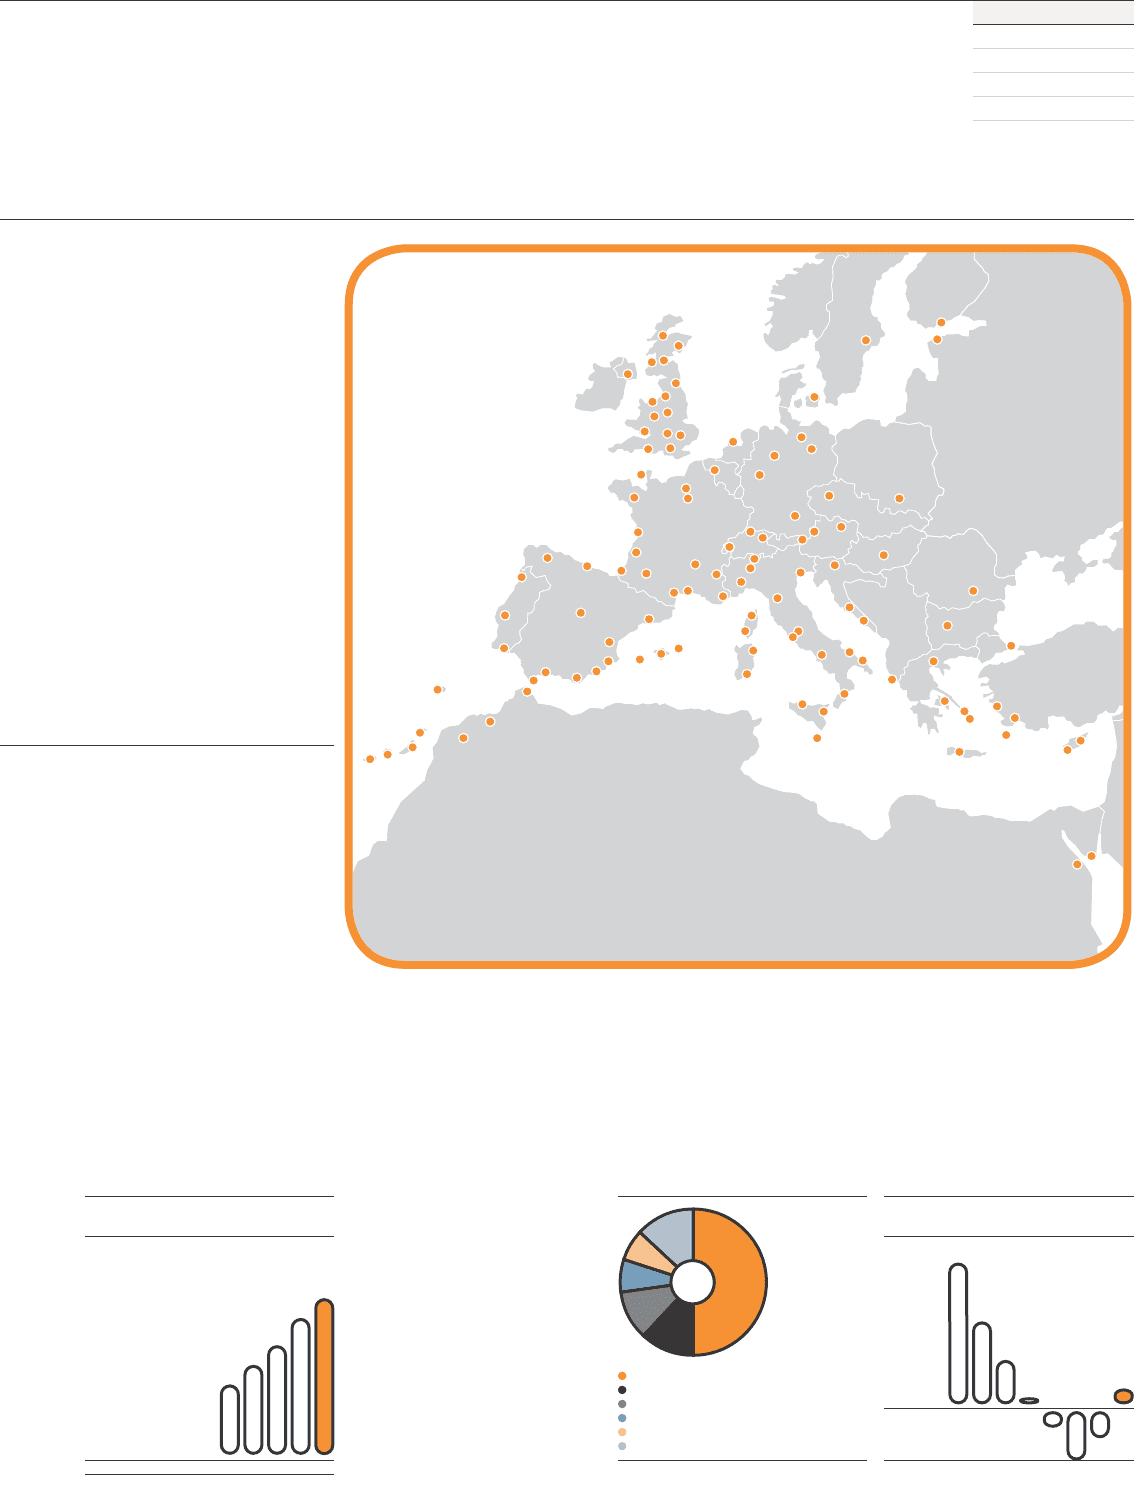
+13.9%
Non-UK passengers million
10.1
12.9
15.7
19.7
22.4
05 06 07 08 09
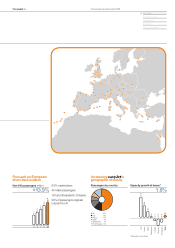
Increasing easyJet’s
geographic diversity
Passengers by country
UK 50%
Italy 12%
France 11%
Spain 7%
Switzerland 7%
Other Europe 13%
1.8%
Capacity growth at bases*
0.9
(3.1)
(23.1)
(8.4)
1.8
16.3
29.8
77.6
UK Regions
Germany
London
Switzerland
Spain
France
Italy
Total
*Measured in seats flown.