EasyJet 2009 Annual Report Download - page 72
Download and view the complete annual report
Please find page 72 of the 2009 EasyJet annual report below. You can navigate through the pages in the report by either clicking on the pages listed below, or by using the keyword search tool below to find specific information within the annual report.-
 1
1 -
2
-
3
-
4
-
5
-
6
-
7
-
8
-
9
-
10
-
11
-
12
-
13
-
14
-
15
-
16
-
17
-
18
-
19
-
20
-
21
-
22
-
23
-
24
-
25
-
26
-
27
-
28
-
29
-
30
-
31
-
32
-
33
-
34
-
35
-
36
-
37
-
38
-
39
-
40
-
41
-
42
-
43
-
44
-
45
-
46
-
47
-
48
-
49
-
50
-
51
-
52
-
53
-
54
-
55
-
56
-
57
-
58
-
59
-
60
-
61
-
 62
62 -
 63
63 -
 64
64 -
 65
65 -
 66
66 -
 67
67 -
 68
68 -
 69
69 -
 70
70 -
 71
71 -
 72
72 -
 73
73 -
 74
74 -
 75
75 -
 76
76 -
 77
77 -
 78
78 -
 79
79 -
 80
80 -
 81
81 -
 82
82 -
83
-
84
-
85
-
86
-
87
-
88
-
89
-
90
-
91
-
92
-
93
-
94
-
95
-
96
 |
 |

70 easyJet plc Annual report and accounts 2009
NOTES TO THE ACCOUNTS CONTINUED
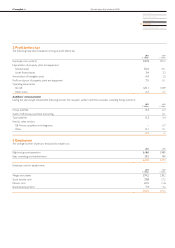
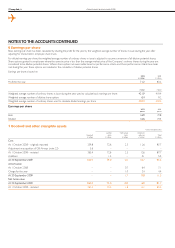
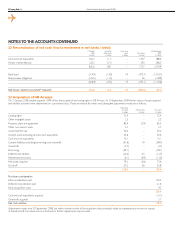
6 Earnings per share
Basic earnings per share has been calculated by dividing the profit for the year by the weighted average number of shares in issue during the year after
adjusting for shares held in employee share trusts.
For diluted earnings per share, the weighted average number of ordinary shares in issue is adjusted to assume conversion of all dilutive potential shares.
Share options granted to employees where the exercise price is less than the average market price of the Company’s ordinary shares during the year are
considered to be dilutive potential shares. Where share options are exercisable based on performance criteria and those performance criteria have been
met during the year, these options are included in the calculation of dilutive potential shares.
Earnings per share is based on:
2009
£ million
2008
£ million
Profit for the year 71.2 83.2
million million
Weighted average number of ordinary shares in issue during the year used to calculate basic earnings per share 421.9 419.4
Weighted average number of dilutive share options 6.4 9.2
Weighted average number of ordinary shares used to calculate diluted earnings per share 428.3 428.6
Earnings per share
2009
pence
2008
pence
Basic 16.9 19.8
Diluted 16.6 19.4
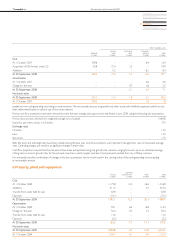
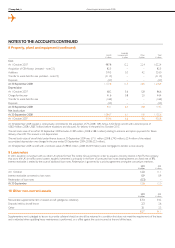
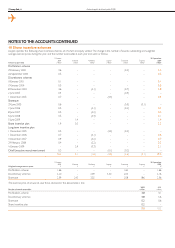
7 Goodwill and other intangible assets
Other intangible assets
Goodwill
£ million
Landing
rights
£ million
Contractual
rights
£ million
Computer
software
£ million
Total
£ million
Cost
At 1 October 2008 – originally reported 359.8 72.6 2.5 12.6 87.7
Adjustment re acquisition of GB Airways (note 23) 5.6 – – – –
At 1 October 2008 – restated 365.4 72.6 2.5 12.6 87.7
Additions – 1.4 – 4.1 5.5
At 30 September 2009 365.4 74.0 2.5 16.7 93.2
Amortisation
At 1 October 2008 – – 0.7 6.4 7.1
Charge for the year – – 1.0 3.4 4.4
At 30 September 2009 – – 1.7 9.8 11.5
Net book value
At 30 September 2009 365.4 74.0 0.8 6.9 81.7
At 1 October 2008 – restated 365.4 72.6 1.8 6.2 80.6