EasyJet 2009 Annual Report Download - page 73
Download and view the complete annual report
Please find page 73 of the 2009 EasyJet annual report below. You can navigate through the pages in the report by either clicking on the pages listed below, or by using the keyword search tool below to find specific information within the annual report.-
 1
1 -
2
-
3
-
4
-
5
-
6
-
7
-
8
-
9
-
10
-
11
-
12
-
13
-
14
-
15
-
16
-
17
-
18
-
19
-
20
-
21
-
22
-
23
-
24
-
25
-
26
-
27
-
28
-
29
-
30
-
31
-
32
-
33
-
34
-
35
-
36
-
37
-
38
-
39
-
40
-
41
-
42
-
43
-
44
-
45
-
46
-
47
-
48
-
49
-
50
-
51
-
52
-
53
-
54
-
55
-
56
-
57
-
58
-
59
-
60
-
61
-
62
-
 63
63 -
 64
64 -
 65
65 -
 66
66 -
 67
67 -
 68
68 -
 69
69 -
 70
70 -
 71
71 -
 72
72 -
 73
73 -
 74
74 -
 75
75 -
 76
76 -
 77
77 -
 78
78 -
 79
79 -
 80
80 -
 81
81 -
 82
82 -
 83
83 -
84
-
85
-
86
-
87
-
88
-
89
-
90
-
91
-
92
-
93
-
94
-
95
-
96
 |
 |

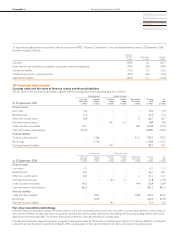
71 easyJet plc Annual report and accounts 2009
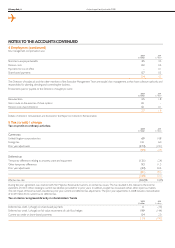
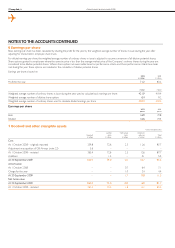
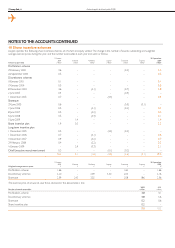
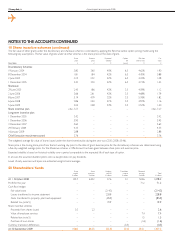
Other intangible assets
Goodwill
£ million
Landing
rights
£ million
Contractual
rights
£ million
Computer
software
£ million
Total
£ million
Cost
At 1 October 2007 309.6 – – 6.4 6.4
Acquisition of GB Airways (note 23) 55.8 72.4 2.5 – 74.9
Additions – 0.2 – 6.2 6.4
At 30 September 2008 365.4 72.6 2.5 12.6 87.7
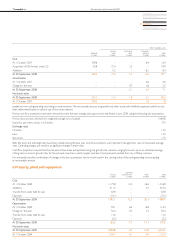
Amortisation
At 1 October 2007 – – – 4.6 4.6
Charge for the year – – 0.7 1.8 2.5
At 30 September 2008 – – 0.7 6.4 7.1
Net book value
At 30 September 2008 365.4 72.6 1.8 6.2 80.6
At 1 October 2007 309.6 – – 1.8 1.8
easyJet has one cash-generating unit, being its route network. The recoverable amount of goodwill and other assets with indefinite expected useful lives has
been determined based on value in use of the route network.
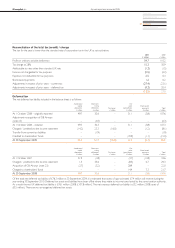
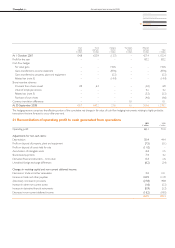
Pre-tax cash flow projections have been derived from the five-year strategic plan approved by the Board in June 2009, using the following key assumptions:
Pre-tax discount rate (derived from weighted average cost of capital) 10.69%
Fuel price, per metric tonne, in US dollars 775
Exchange rates
US dollar 1.55
Euro 1.20
Swiss franc 1.70
Both fuel price and exchange rates have been volatile during the past year, and the assumptions used represent management’s view of reasonable average
rates. Operating margins are sensitive to significant changes in these rates.
Cash flow projections beyond the forecast period have been extrapolated using real growth rate scenarios ranging from zero up to an estimated average
of long-term economic growth rates for the principal countries in which easyJet operates. No impairment resulted from any of these scenarios.
No reasonably possible combination of changes in the key assumptions above would result in the carrying value of the cash-generating unit exceeding
its recoverable amount.
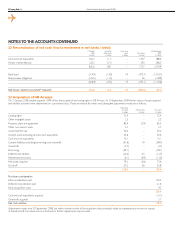
8 Property, plant and equipment
Aircraft
£ million
Leasehold
improvements
£ million
Other
£ million
Total
£ million
Cost
At 1 October 2008 1,177.8 12.5 26.6 1,216.9
Additions 511.5 – 3.5 515.0
Transfer from assets held for sale 67.9 – – 67.9
Disposals (10.1) – – (10.1)
At 30 September 2009 1,747.1 12.5 30.1 1,789.7
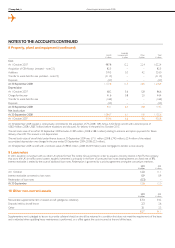
Depreciation
At 1 October 2008 93.1 6.4 14.8 114.3
Charge for the year 52.4 0.7 2.3 55.4
Transfer from assets held for sale 13.0 – – 13.0
Disposals (5.2) – – (5.2)
At 30 September 2009 153.3 7.1 17.1 177.5
Net book value
At 30 September 2009 1,593.8 5.4 13.0 1,612.2
At 1 October 2008 1,084.7 6.1 11.8 1,102.6