EasyJet 2009 Annual Report Download - page 61
Download and view the complete annual report
Please find page 61 of the 2009 EasyJet annual report below. You can navigate through the pages in the report by either clicking on the pages listed below, or by using the keyword search tool below to find specific information within the annual report.-
 1
1 -
2
-
3
-
4
-
5
-
6
-
7
-
8
-
9
-
10
-
11
-
12
-
13
-
14
-
15
-
16
-
17
-
18
-
19
-
20
-
21
-
22
-
23
-
24
-
25
-
26
-
27
-
28
-
29
-
30
-
31
-
32
-
33
-
34
-
35
-
36
-
37
-
38
-
39
-
40
-
41
-
42
-
43
-
44
-
45
-
46
-
47
-
48
-
49
-
50
-
 51
51 -
 52
52 -
 53
53 -
 54
54 -
 55
55 -
 56
56 -
 57
57 -
 58
58 -
 59
59 -
 60
60 -
 61
61 -
 62
62 -
 63
63 -
 64
64 -
 65
65 -
 66
66 -
 67
67 -
 68
68 -
 69
69 -
 70
70 -
 71
71 -
72
-
73
-
74
-
75
-
76
-
77
-
78
-
79
-
80
-
81
-
82
-
83
-
84
-
85
-
86
-
87
-
88
-
89
-
90
-
91
-
92
-
93
-
94
-
95
-
96
 |
 |

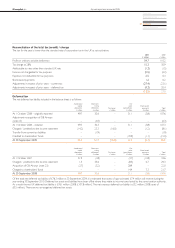
59 easyJet plc Annual report and accounts 2009
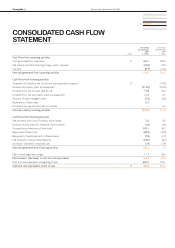
CONSOLIDATED CASH FLOW
STATEMENT
Notes
Year ended
30 September
2009
£ million
Year ended
30 September
2008
£ million
Cash flows from operating activities
Cash generated from operations 21 164.5 290.4
Net interest and other financing charges (paid) / received (20.6) 20.0
Tax paid (9.4) (14.2)
Net cash generated from operating activities 134.5 296.2
Cash flows from investing activities
Acquisition of subsidiary, net of cash and cash equivalents acquired 23 –(118.0)
Purchase of property, plant and equipment (515.0) (324.0)
Proceeds from sale of assets held for sale 77.8 30.0
Proceeds from sale of property, plant and equipment 12.4 0.5
Purchase of other intangible assets (5.5) (6.4)
Redemption of loan notes 0.3 –
Proceeds from sale of investment in associate –0.3
Net cash used by investing activities (430.0) (417.6)
Cash flows from financing activities
Net proceeds from issue of ordinary share capital 2.6 6.9
Purchase of own shares for employee share schemes (1.6) (4.6)
Proceeds from drawdown of bank loans 543.1 40.2
Repayment of bank loans (69.4) (43.0)
Repayment of capital elements of finance leases (3.6) (2.7)
Net increase in money market deposits (29.0) (8.7)
(Increase) / decrease in restricted cash (1.9) 17.8
Net cash generated from financing activities 440.2 5.9
Effect of exchange rate changes 11.7 28.6
Net increase / (decrease) in cash and cash equivalents 156.4 (86.9)
Cash and cash equivalents at beginning of year 632.2 719.1
Cash and cash equivalents at end of year 13 788.6 632.2