EasyJet 2009 Annual Report Download - page 24
Download and view the complete annual report
Please find page 24 of the 2009 EasyJet annual report below. You can navigate through the pages in the report by either clicking on the pages listed below, or by using the keyword search tool below to find specific information within the annual report.-
 1
1 -
2
-
3
-
4
-
5
-
6
-
7
-
8
-
9
-
10
-
11
-
12
-
13
-
 14
14 -
 15
15 -
 16
16 -
 17
17 -
 18
18 -
 19
19 -
 20
20 -
 21
21 -
 22
22 -
 23
23 -
 24
24 -
 25
25 -
 26
26 -
 27
27 -
 28
28 -
 29
29 -
 30
30 -
 31
31 -
 32
32 -
 33
33 -
 34
34 -
35
-
36
-
37
-
38
-
39
-
40
-
41
-
42
-
43
-
44
-
45
-
46
-
47
-
48
-
49
-
50
-
51
-
52
-
53
-
54
-
55
-
56
-
57
-
58
-
59
-
60
-
61
-
62
-
63
-
64
-
65
-
66
-
67
-
68
-
69
-
70
-
71
-
72
-
73
-
74
-
75
-
76
-
77
-
78
-
79
-
80
-
81
-
82
-
83
-
84
-
85
-
86
-
87
-
88
-
89
-
90
-
91
-
92
-
93
-
94
-
95
-
96
 |
 |

22 easyJet plc Annual report and accounts 2009
q
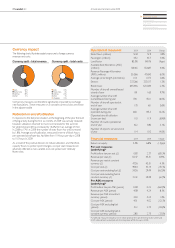
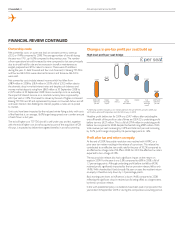
Total revenue
Total revenue in 2009 grew by 12.9% to £2,666.8 million which equates
to £50.47 per seat, representing a growth of £4.96 per seat or 10.9%.
On a constant currency basis, total revenue per seat grew 4.1%; after allowing
for the increase in sector length of 2.6%, this represents a strong underlying
performance, particularly in light of the difcult external economic conditions.
This result has been supported by the continuing strategy to increasingly
deploy capacity to the better located but more expensive airports preferred
by customers and thereby improve network mix.
Passenger revenue
Passenger revenue in 2009 grew by 7.8% to £2,150.5 million. Despite the
16.0% increase in average aircraft during the period, capacity in terms of seats
own increased by only 1.8% as a result of the decision to reduce ying activity
particularly through the winter. Load factor improved 1.4ppt to 85.5%, the rst
time since 2005 that the annual load factor has exceeded 85%. This resulted
in a 3.4% increase in passenger numbers to 45.2 million demonstrating a ight
to value as easyJet increased market share by attracting customers from
higher fare competitors.
The shift towards deploying relatively more capacity to European markets
continues. Capacity in total rose 1.8% in 2009 versus 2008; of this overall
increase, capacity at UK regional bases reduced by 8.4% whilst continental
European bases increased by 16.0% with most of this investment being
focused in Milan Malpensa, Paris Charles de Gaulle and Lyon. London bases,
in aggregate, reduced by 3.1% with Gatwick capacity up by 11.5% but Luton
and Stansted reducing by 18.3% and 16.3% respectively. The percentage of
revenues denominated in euros in 2009 was 42% with, in aggregate,
non-sterling revenues now accounting for 51% of total revenues.
Passenger revenue per seat increased by 5.9% to £40.70 but on a constant
currency basis fell by 1.9%. This reduction in revenue per seat in the current
economic environment, taking into account the expected dilution from an
increase in the checked bag charge, is testament to the strength of the
network. Passenger revenue per ASK, on a constant currency basis,
fell by 4.4%.
Ancillary revenue
Ancillary revenue increased by 40.6% to £516.3 million in 2009, driven mainly
by increases in the checked bag charge. Bag charge revenue delivered
£238.1 million in 2009, an increase of £94.0 million or 65.2% compared
to the previous year. As expected, this has been accompanied by a small
yield dilution, but with approximately 70% of passengers having checked
baggage, the net result is positive. Speedy Boarding continues to deliver
a strong performance.
FINANCIAL REVIEW CONTINUED
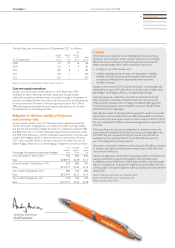
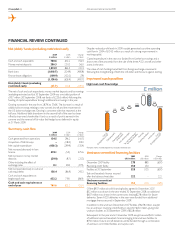
Costs
Underlying costs*
2009
£ million
2009
per seat
2008
£ million
2008
per seat
Ground handling 255.9 4.84 212.2 4.09
Airport charges 481.5 9.11 397.2 7.65
Fuel 807.2 15.28 708.7 13.65
Navigation 232.3 4.40 195.7 3.77
Crew 306.6 5.80 263.2 5.07
Maintenance 161.6 3.06 147. 5 2.84
Advertising 47.0 0.89 46.5 0.90
Merchant fees and
commissions 33.5 0.64 33.7 0.65
Aircraft and passenger
insurance 11. 3 0.21 9.1 0.17
Other costs 104.8 1.98 87. 5 1.68
Total operating costs 2,441.7 46.21 2,101.3 40.47
Net ownership costs 181.4 3.43 13 8 .4 2.67
Total costs 2,623.1 49.64 2,239.7 43.14
Total operating costs
excluding fuel 1,634.5 30.93 1,392.6 26.82
Total costs
excluding fuel 1,815.9 34.36 1,531.0 29.49
*Underlying measures exclude the £11.0 million prot on disposal of assets held for sale in 2009
and £12.9 million of GB Airways integration costs in 2008.
Total costs
Total cost per seat excluding fuel was up 16.5% or £4.87 per seat to £34.36 in
2009, compared to 2008. In addition to the strengthening of the US dollar and
euro, the Swiss franc strengthened by 19%. As a signicant proportion of the
cost base is denominated in these currencies, this has had a signicant impact
on unit costs. Excluding the impact of exchange rates, cost per seat excluding
fuel was up 6.2% or £1.83 per seat compared to last year.
The impact of the reduction in global interest rates has had a signicant impact
on interest income in the year; interest income in 2009 at £18.4 million was
£30.5 million lower than the £48.9 million reported in 2008. These changes in
interest rates are largely out of easyJet’s control so, excluding the impact of this
reduction, operating cost per seat (excluding fuel and at constant currency)
was up 3.9% compared to 2008. On a cost per ASK basis, excluding fuel,
costs increased by 13.6% but on a constant currency basis by just 3.5%.
Again, excluding the impact of interest income, this gure falls to 1.3%.
As a result of the reduction in winter ying activity and utilisation, unit cost
measures are adversely impacted as non-variable costs are spread over
relatively fewer units of production.