EasyJet 2009 Annual Report Download - page 26
Download and view the complete annual report
Please find page 26 of the 2009 EasyJet annual report below. You can navigate through the pages in the report by either clicking on the pages listed below, or by using the keyword search tool below to find specific information within the annual report.-
 1
1 -
2
-
3
-
4
-
5
-
6
-
7
-
8
-
9
-
10
-
11
-
12
-
13
-
14
-
15
-
 16
16 -
 17
17 -
 18
18 -
 19
19 -
 20
20 -
 21
21 -
 22
22 -
 23
23 -
 24
24 -
 25
25 -
 26
26 -
 27
27 -
 28
28 -
 29
29 -
 30
30 -
 31
31 -
 32
32 -
 33
33 -
 34
34 -
 35
35 -
 36
36 -
37
-
38
-
39
-
40
-
41
-
42
-
43
-
44
-
45
-
46
-
47
-
48
-
49
-
50
-
51
-
52
-
53
-
54
-
55
-
56
-
57
-
58
-
59
-
60
-
61
-
62
-
63
-
64
-
65
-
66
-
67
-
68
-
69
-
70
-
71
-
72
-
73
-
74
-
75
-
76
-
77
-
78
-
79
-
80
-
81
-
82
-
83
-
84
-
85
-
86
-
87
-
88
-
89
-
90
-
91
-
92
-
93
-
94
-
95
-
96
 |
 |
24 easyJet plc Annual report and accounts 2009
q
FINANCIAL REVIEW CONTINUED
Ownership costs
Net ownership costs, on a per seat basis at constant currency, were up
£0.52 or 19.4% compared to 2008. The average number of aircraft during
the year was 174.1, up 16.0% compared to the previous year. The number
of non-operational aircraft increased by nine compared to last year principally
due to aircraft held for sale and an increase in aircraft in maintenance as
easyJet prepared aircraft for return to lessors. There were 35 additions
during the year, 31 debt nanced and four cash nanced; 12 Boeing 737-700s
and four ex-GB A320s were returned to lessors and three ex-GB A321s
were sold.
Net ownership costs include interest income which has fallen from
£48.9 million in 2008 to £18.4 million in 2009, a fall of £30.5 million due to
the dramatic drop in market interest rates and despite cash balances and
money market deposits rising from £863 million at 30 September 2008 to
£1,075 million at 30 September 2009. Gross ownership costs i.e. excluding
the impact of interest income, on a constant currency basis, improved by
£0.13 per seat or 3.5%. This benet is driven by the exit of higher cost leased
Boeing 737-700 aircraft and replacement by lower cost owned Airbus aircraft
and lower interest rates feeding into interest payable as rates are re-priced
to market.
Unit costs have been impacted by the reduced winter ying activity with costs
of the eet that is, on average, 16.0% larger being spread over a similar amount
of seats own as last year.
The exit of higher cost 737-700 aircraft is well under way and this, together
with the exit of higher cost aircraft acquired as part of the acquisition of GB
Airways, is expected to deliver the targeted benets in aircraft ownership.
*Underlying number; excludes an £11 million prot on the sale of three aircraft in 2009 and
£12.9 million of one-off integration costs for GB Airways in 2008.
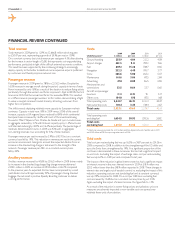
Headline prot before tax for 2009 was £54.7 million; after excluding the
one-off benet of the prot on sale of three ex-GB A321s, underlying prot
before tax was £43.7 million. This is a fall of £79.4 million in underlying prot
before tax compared to 2008, despite the fuel bill rising £98.5 million. With
total revenue per seat increasing by 10.9% and total cost per seat increasing
by 15.1%, prot margin dropped by 3.6 percentage points to 1.6%.
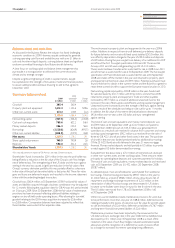
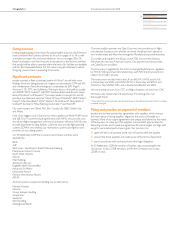
Profit after tax and return on equity
At the end of 2009, favourable resolution was reached with HMRC on a
prior year tax matter resulting in the release of a provision. This release has
contributed to an effective tax credit rate for the year of 30.2% compared to
an effective tax charge rate of 24.5% in 2008. For 2010 the effective tax rate is
expected to be a charge of 25%.
The tax provision release also had a signicant impact on the return on
equity in 2009. For the year it was 5.5% compared to 6.8% in 2008, a fall of
1.3 percentage points. Although underlying prot before tax fell by 64.5%,
retained prot, signicantly impacted by the tax provision release, fell by only
14.4%. With shareholders’ funds broadly at year on year, the resultant return
on equity is therefore only down by 1.3 percentage points.
Basic earnings per share, at 16.9 pence, is down 14.6% compared to 2008,
reecting the signicant drop in retained prot, being offset, to a large extent,
by the tax provision release.
In line with established policy, no dividends have been paid or proposed in the
year ended 30 September 2009 or during the comparative accounting period.
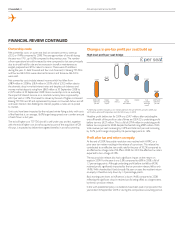
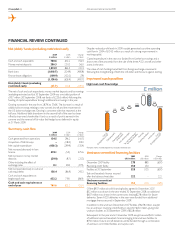
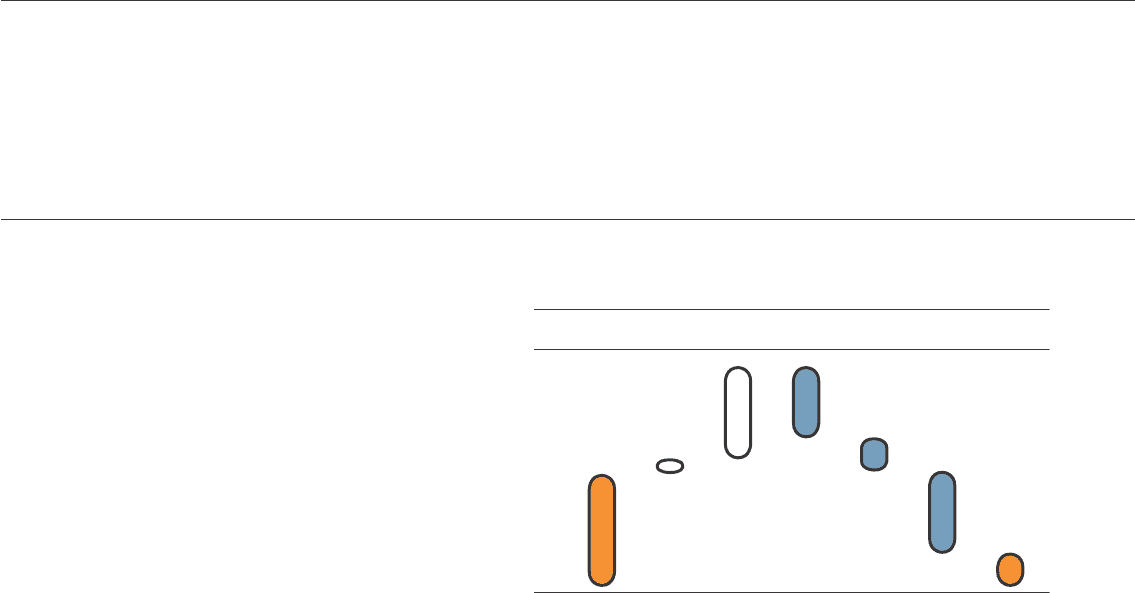
Changes in pre-tax profit per seat build up
£ per seat
High level profit per seat bridge
£0.83
£2.37 £1.63
£0.07
£1.85 £1.19
£0.64
2008 prot
before tax
per seat
Foreign
exchange
impact
Total
revenue
Costs
excl. fuel
excl. interest
Interest Fuel
inc. foreign
exchange
impact
2009 prot
before tax
per seat