EasyJet 2009 Annual Report Download - page 23
Download and view the complete annual report
Please find page 23 of the 2009 EasyJet annual report below. You can navigate through the pages in the report by either clicking on the pages listed below, or by using the keyword search tool below to find specific information within the annual report.-
 1
1 -
2
-
3
-
4
-
5
-
6
-
7
-
8
-
9
-
10
-
11
-
12
-
 13
13 -
 14
14 -
 15
15 -
 16
16 -
 17
17 -
 18
18 -
 19
19 -
 20
20 -
 21
21 -
 22
22 -
 23
23 -
 24
24 -
 25
25 -
 26
26 -
 27
27 -
 28
28 -
 29
29 -
 30
30 -
 31
31 -
 32
32 -
 33
33 -
34
-
35
-
36
-
37
-
38
-
39
-
40
-
41
-
42
-
43
-
44
-
45
-
46
-
47
-
48
-
49
-
50
-
51
-
52
-
53
-
54
-
55
-
56
-
57
-
58
-
59
-
60
-
61
-
62
-
63
-
64
-
65
-
66
-
67
-
68
-
69
-
70
-
71
-
72
-
73
-
74
-
75
-
76
-
77
-
78
-
79
-
80
-
81
-
82
-
83
-
84
-
85
-
86
-
87
-
88
-
89
-
90
-
91
-
92
-
93
-
94
-
95
-
96
 |
 |
Annual report and accounts 200921 easyJet plc
q
Overview
Business review
Governance
Accounts
Other information
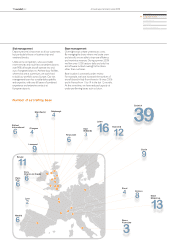
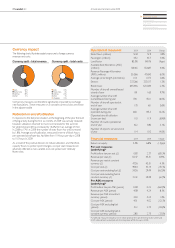
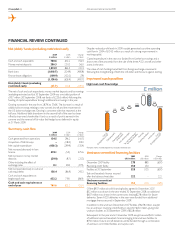
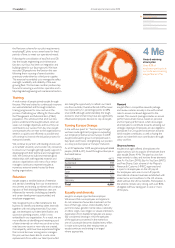
Currency impact
Currency split – total revenue
The following charts illustrate easyJet’s exposure to foreign currency
revenues and costs:
euro 42%
Swiss franc 6%
sterling 49%
other 3%
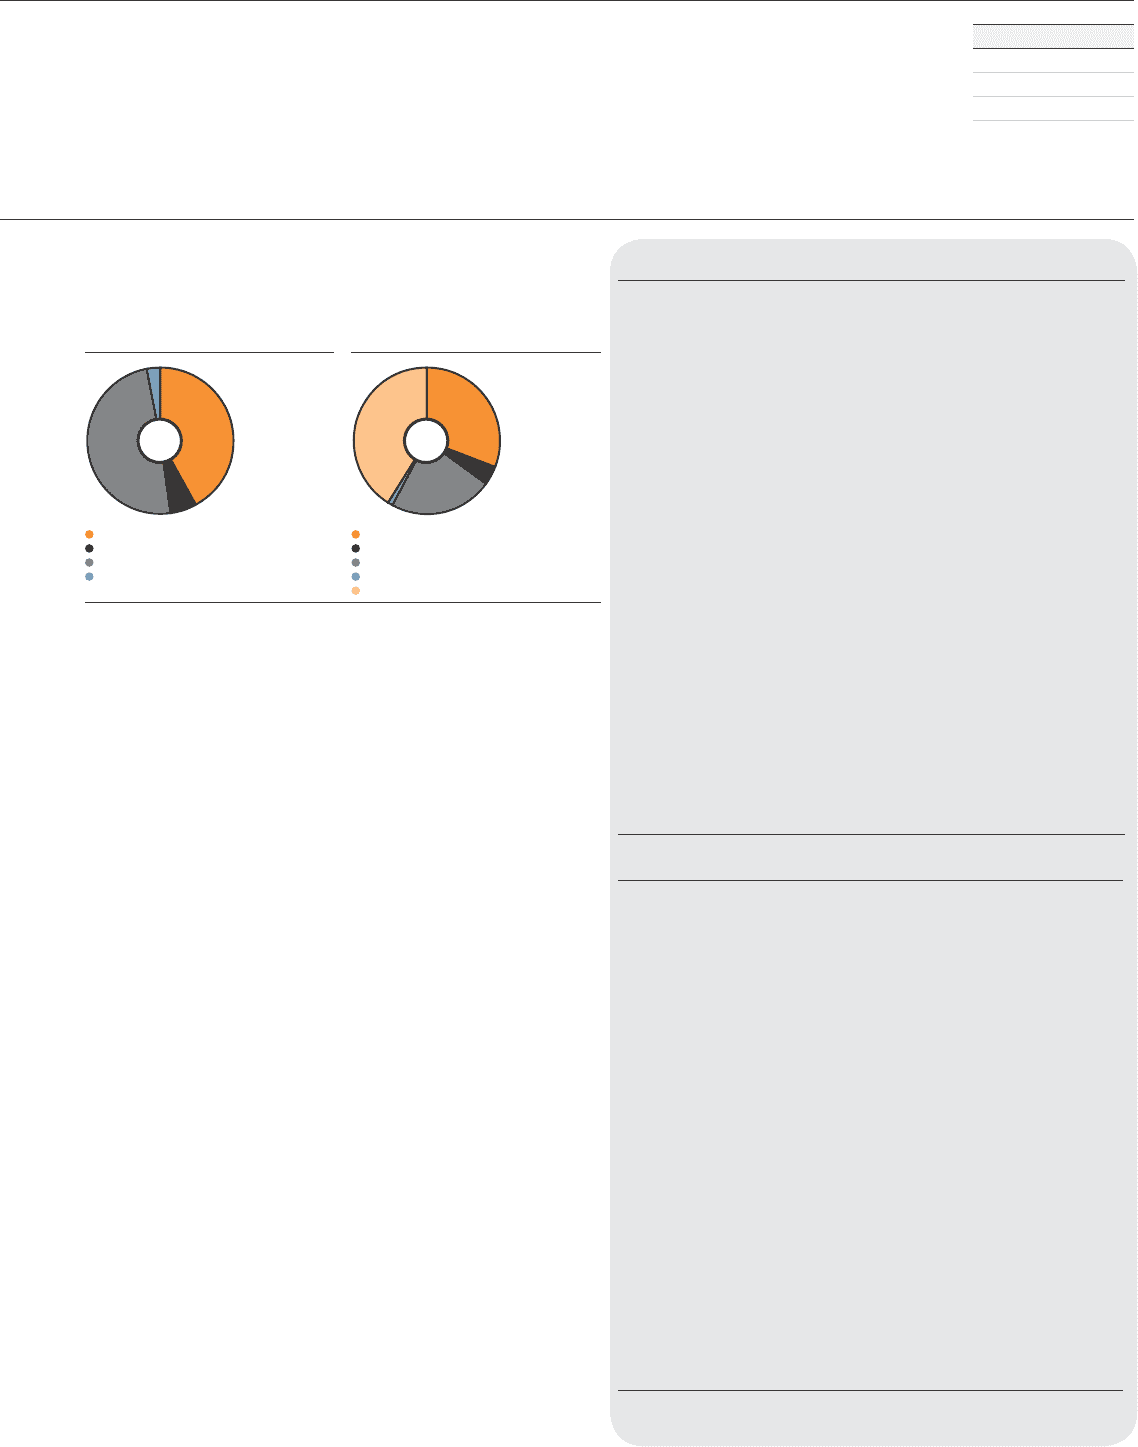
Currency split – total costs
euro 31%
Swiss franc 4%
sterling 23%
other 1%
US dollar 41%
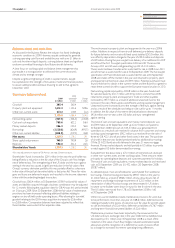
Certain key measures are therefore signicantly impacted by exchange
rate uctuations. These measures on a constant currency basis are shown
in the adjacent table:
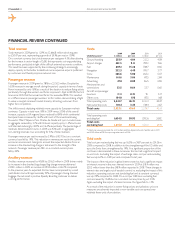
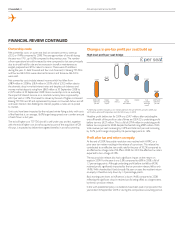
Reduction in aircraft utilisation
In response to the fuel price situation at the beginning of the year, the level
of ying activity during the rst six months of 2009 was actively reduced;
however, utilisation returned to more normal levels for the summer.
So while total aircraft has increased by 16.0% from an average of 150.1
in 2008 to 174.1 in 2009, the number of seats own has only increased
by 1.8%. Average aircraft utilisation, measured in terms of block hours
per operated aircraft per day, has fallen from 11.9 hours per day in 2008
to 11.0 hours in 2009.
As a result of this positive decision to reduce utilisation, and therefore
capacity own, to protect prot margins, cost per seat measures are
adversely affected as non-variable costs are spread over relatively
fewer seats.
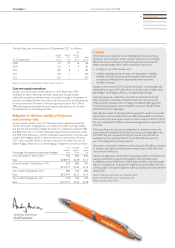
Operational measures 2009 2008 Change
Seats own (millions) 52.8 51.9 1.8%
Passengers (millions) 45.2 43.7 3.4%
Load factor 85.5% 84.1% 1.4ppt
Available Seat Kilometres (ASK)
(millions) 58,165 55,687 4.4%
Revenue Passenger Kilometres
(RPK) (millions) 50,566 47,690 6.0%
Average sector length (kilometres) 1,101 1,073 2.6%
Sectors 337, 266 333,017 1.3%
Block hours 645,446 631,084 2.3%
Number of aircraft owned/leased
at end of year 181 165 9.7%
Average number of aircraft
owned/leased during year 174.1 150.1 16.0%
Number of aircraft operated at
end of year 170 161 5.6%
Average number of aircraft
operated during year 160.1 145.3 10.2%
Operated aircraft utilisation
(hours per day) 11. 0 11. 9 (6.9)%
Number of routes operated at
end of year 422 380 11.1%
Number of airports served at end
of year 114 100 14.0%
Financial measures 2009 2008 Change
Return on equity 5.5% 6.8% (1.3)ppt
Per seat measures
(underlying)*
Prot before tax per seat (£) 0.83 2.37 (65.1)%
Revenue per seat (£) 50.47 45. 51 10.9%
Revenue per seat at constant
currency (£) 47. 36 45. 51 4.1%
Cost per seat (£) 49.64 43.14 (15.1)%
Cost per seat excluding fuel (£) 34.36 29.49 (16 . 5)%
Cost per seat excluding fuel at
constant currency (£) 31.32 29.49 (6.2)%
Per ASK measures
(underlying)*
Prot before tax per ASK (pence) 0.08 0.22 (66.0)%
Revenue per ASK (pence) 4.58 4.24 8.1%
Revenue per ASK at constant
currency (pence) 4.30 4.24 1.4%
Cost per ASK (pence) 4. 51 4.02 (12.1)%
Cost per ASK excluding fuel
(pence) 3.12 2.75 (13.6)%
Cost per ASK excluding fuel at
constant currency (pence) 2.85 2.75 (3.5)%
*Underlying measures exclude an £11.0 million prot on the sale of three aircraft in 2009 and
£12.9 million of costs associated with the integration of GB Airways in 2008 .