EasyJet 2009 Annual Report Download - page 3
Download and view the complete annual report
Please find page 3 of the 2009 EasyJet annual report below. You can navigate through the pages in the report by either clicking on the pages listed below, or by using the keyword search tool below to find specific information within the annual report.-
 1
1 -
 2
2 -
 3
3 -
 4
4 -
 5
5 -
 6
6 -
 7
7 -
 8
8 -
 9
9 -
 10
10 -
 11
11 -
 12
12 -
 13
13 -
 14
14 -
15
-
16
-
17
-
18
-
19
-
20
-
21
-
22
-
23
-
24
-
25
-
26
-
27
-
28
-
29
-
30
-
31
-
32
-
33
-
34
-
35
-
36
-
37
-
38
-
39
-
40
-
41
-
42
-
43
-
44
-
45
-
46
-
47
-
48
-
49
-
50
-
51
-
52
-
53
-
54
-
55
-
56
-
57
-
58
-
59
-
60
-
61
-
62
-
63
-
64
-
65
-
66
-
67
-
68
-
69
-
70
-
71
-
72
-
73
-
74
-
75
-
76
-
77
-
78
-
79
-
80
-
81
-
82
-
83
-
84
-
85
-
86
-
87
-
88
-
89
-
90
-
91
-
92
-
93
-
94
-
95
-
96
 |
 |

01 easyJet plc
Overview
Business review
Governance
Accounts
Other information
q
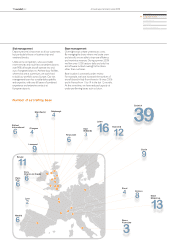
OVERVIEW
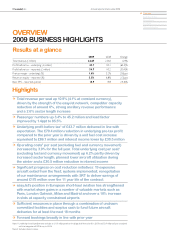
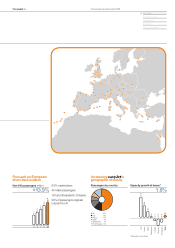
2009 BUSINESS HIGHLIGHTS
Annual report and accounts 2009
2009 2008 Change
Total revenue (£ million) 2,667 2,363 12 .9%
Prot before tax – underlying1 (£ million) 43.7 123.1 (64.5)%
Prot before tax – reported (£ million) 54.7 110 . 2 (50.4)%
Pre-tax margin – underlying1 (%) 1.6% 5.2% (3.6)ppt
Return on equity – reported (%) 5.5% 6.8% (1.3)ppt
Basic EPS – reported (pence) 16.9 19.8 (14.6)%
Total revenue per seat up 10.9% (4.1% at constant currency), q
driven by the strength of the easyJet network, competitor capacity
reduction of around 6%, strong ancillary revenue performance
and a 2.6% sector length increase
Passenger numbers up 3.4% to 45.2 million and load factor
q
improved by 1.4ppt to 85.5%
Underlying profit before tax q1 of £43.7 million delivered in line with
expectation. The £79.4 million reduction in underlying pre-tax profit
compared to the prior year is driven by a unit fuel cost increase
equivalent to £86.1 million and interest income lower by £30.5 million
Operating costs
q2 per seat (excluding fuel and currency movement)
increased by 3.9% for the full year. Total underlying cost per seat1
(excluding fuel and currency movement) up 6.2% partly driven by
increased sector length, planned lower aircraft utilisation during
the winter and a £30.5 million reduction in interest income
Significant progress on cost reduction initiatives: 19 expensive
q
aircraft exited from the fleet; systems implemented; renegotiation
of our maintenance arrangements with SRT to deliver savings of
around £175 million over the 11 year life of the contract
easyJet’s position in European short-haul aviation has strengthened
q
with market share gains in a number of valuable markets such as
Paris, London Gatwick, Milan and Madrid and over a 10% increase
in slots at capacity constrained airports
Sufficient resources in place through a combination of undrawn
q
committed facilities and surplus cash to fund future aircraft
deliveries for at least the next 18 months
Forward bookings broadly in line with prior year
q
Note 1: Underlying nancial performance excludes an £11.0 million prot on the disposal of three aircraft in 2009, and £12.9 million of costs associated
with the integration of GB Airways in 2008.
Note 2: Excludes interest income.
Highlights
Results at a glance