EasyJet 2009 Annual Report Download - page 81
Download and view the complete annual report
Please find page 81 of the 2009 EasyJet annual report below. You can navigate through the pages in the report by either clicking on the pages listed below, or by using the keyword search tool below to find specific information within the annual report.-
 1
1 -
2
-
3
-
4
-
5
-
6
-
7
-
8
-
9
-
10
-
11
-
12
-
13
-
14
-
15
-
16
-
17
-
18
-
19
-
20
-
21
-
22
-
23
-
24
-
25
-
26
-
27
-
28
-
29
-
30
-
31
-
32
-
33
-
34
-
35
-
36
-
37
-
38
-
39
-
40
-
41
-
42
-
43
-
44
-
45
-
46
-
47
-
48
-
49
-
50
-
51
-
52
-
53
-
54
-
55
-
56
-
57
-
58
-
59
-
60
-
61
-
62
-
63
-
64
-
65
-
66
-
67
-
68
-
69
-
70
-
 71
71 -
 72
72 -
 73
73 -
 74
74 -
 75
75 -
 76
76 -
 77
77 -
 78
78 -
 79
79 -
 80
80 -
 81
81 -
 82
82 -
 83
83 -
 84
84 -
 85
85 -
 86
86 -
 87
87 -
 88
88 -
 89
89 -
 90
90 -
 91
91 -
92
-
93
-
94
-
95
-
96
 |
 |

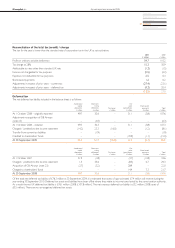
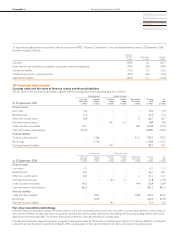
79 easyJet plc Annual report and accounts 2009
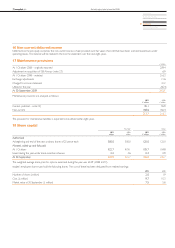
Share
capital
£ million
Share
premium
£ million
Hedging
reserve
£ million
Translation
reserve
£ million
Retained
earnings
£ million
Total
£ million
At 1 October 2007 104.8 633.9 (13.7) – 427.4 1,152.4
Profit for the year –––– 83.283.2
Cash flow hedges
Fair value gains – – 143.6 – – 143.6
Gains transferred to income statement – – (87.6) – – (87.6)
Gains transferred to property, plant and equipment – – (0.3) – – (0.3)
Related tax (note 5) – – (14.4) – – (14.4)
Share incentive schemes
Proceeds from shares issued 0.9 6.3 – – (0.3) 6.9
Value of employee services –––– 4.24.2
Related tax (note 5) –––– (5.3)(5.3)
Purchase of own shares –––– (4.6)(4.6)
Currency translation differences – – – 0.1 – 0.1
At 30 September 2008 105.7 640.2 27.6 0.1 504.6 1,278.2
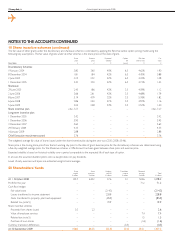
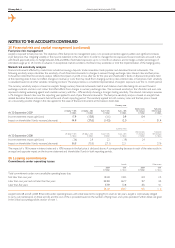
The hedging reserve comprises the effective portion of the cumulative net change in fair value of cash flow hedging instruments relating to highly probable
transactions that are forecast to occur after year end.
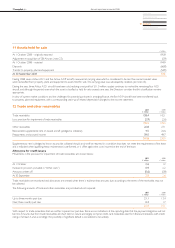
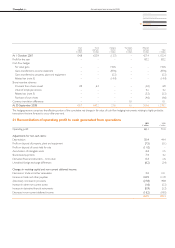
21 Reconciliation of operating profit to cash generated from operations
2009
£ million
2008
£ million
Operating profit 60.1 91.0
Adjustments for non-cash items:
Depreciation 55.4 44.4
Profit on disposal of property, plant and equipment (7.5) (0.1)
Profit on disposal of assets held for sale (11.0) –
Amortisation of intangible assets 4.4 2.5
Share-based payments 7.4 4.2
Derivative financial instruments – time value 0.3 2.6
Unrealised foreign exchange differences (6.2) (3.4)
Changes in working capital and non-current deferred income:
Decrease in trade and other receivables 3.2 10.1
Increase in trade and other payables 104.9 112.9
(Decrease) / increase in provisions (27.8) 49.8
Increase in other non-current assets (1.6) (0.3)
Increase in derivative financial instruments (0.9) (5.3)
Decrease in non-current deferred income (16.2) (18.0)
164.5 290.4