Dish Network 2003 Annual Report Download - page 77
Download and view the complete annual report
Please find page 77 of the 2003 Dish Network annual report below. You can navigate through the pages in the report by either clicking on the pages listed below, or by using the keyword search tool below to find specific information within the annual report.-
 1
1 -
2
-
3
-
4
-
5
-
6
-
7
-
8
-
9
-
10
-
11
-
12
-
13
-
14
-
15
-
16
-
17
-
18
-
19
-
20
-
21
-
22
-
23
-
24
-
25
-
26
-
27
-
28
-
29
-
30
-
31
-
32
-
33
-
34
-
35
-
36
-
37
-
38
-
39
-
40
-
41
-
42
-
43
-
44
-
45
-
46
-
47
-
48
-
49
-
50
-
51
-
52
-
53
-
54
-
55
-
56
-
57
-
58
-
59
-
60
-
61
-
62
-
63
-
64
-
65
-
66
-
 67
67 -
 68
68 -
 69
69 -
 70
70 -
 71
71 -
 72
72 -
 73
73 -
 74
74 -
 75
75 -
 76
76 -
 77
77 -
 78
78 -
 79
79 -
 80
80 -
 81
81 -
 82
82 -
 83
83 -
 84
84 -
 85
85 -
 86
86 -
 87
87 -
88
-
89
-
90
-
91
-
92
-
93
-
94
-
95
-
96
-
97
-
98
-
99
-
100
-
101
-
102
-
103
-
104
-
105
-
106
-
107
-
108
-
109
-
110
-
111
-
112
-
113
-
114
-
115
-
116
-
117
-
118
-
119
-
120
 |
 |

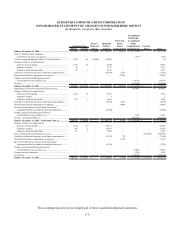
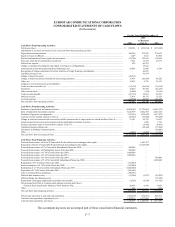
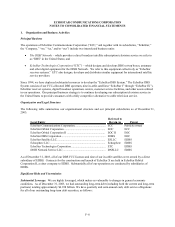
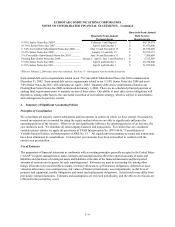
ECHOSTAR COMMUNICATIONS CORPORATION
NOTES TO CONSOLIDATED FINANCIAL STATEMENTS – Continued
F–10
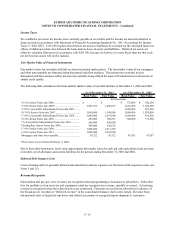
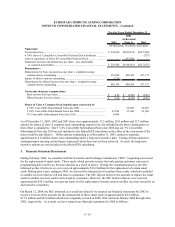
During the three months ended December 31, 2003, we recorded approximately $61.4 million to reduce our estimated
royalty obligations related to the production of EchoStar receiver systems. The following details the decrease in the
financial statement line items affected by this change in estimate (in thousands):
Cost of sales – DTH equipment .................................. $ (6,839)
Cost of sales – subscriber promotion subsidies .......... (42,750)
Depreciation expense................................................... (5,937)
Property and equipment, net........................................ (5,341)
Inventory...................................................................... (505)
Foreign Currency Translation
The functional currency of the majority of our foreign subsidiaries is the U.S. dollar because their sales and purchases
are predominantly denominated in that currency. However, for our subsidiaries where the functional currency is the
local currency, we translate assets and liabilities into U.S. dollars at the period end exchange rate and record the
translation adjustments as a component of other comprehensive income (loss). We translate revenues and expenses
based on the exchange rates at the time such transactions arise, if known, or at the average rate for the period.
Transactions denominated in currencies other than the functional currency are recorded at the exchange rate at the time
of the transaction and are included in other miscellaneous income and expense. Net transaction gains (losses) during
2003, 2002 and 2001 were not significant.
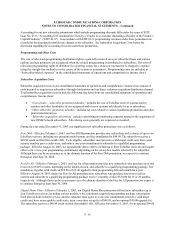
Statements of Cash Flows Data
The following presents our supplemental cash flow statement disclosure:
For the Years Ended December 31,
2003 2002 2001
(In thousands)
Cash paid for interest..................................................................................
$ 477,036 $ 500,879 $ 377,038
Capitalized interest......................................................................................
8,428 23,876 25,647
Cash received for interest............................................................................
64,490 113,402 101,053
Cash paid for income taxes ........................................................................
11,646 8,396 1,832
6 3/4% Series C Cumulative Convertible Preferred Stock dividends .........
- - 337
Conversion of 6 ¾% Series C Cumulative Convertible
Preferred Stock to Class A common stock ............................................
- - 10,948
Forfeitures of deferred non-cash, stock-based compensation .....................
3,933 5,520 12,564
Satellite vendor financing ...........................................................................
10,000 30,000 -
Cash and Cash Equivalents
We consider all liquid investments purchased with an original maturity of 90 days or less to be cash equivalents. Cash
equivalents as of December 31, 2003 and 2002 consist of money market funds, corporate notes and commercial paper.
The cost of these investments approximates their fair market value.
Marketable and Non-Marketable Investment Securities and Restricted Cash
We currently classify all marketable investment securities as available-for-sale. We adjust the carrying value of our
available-for-sale securities to fair market value and report the related temporary unrealized gains and losses as a
separate component of stockholders’ deficit, net of related deferred income tax. Declines in the fair market value of a
marketable investment security which are estimated to be “other than temporary” are recognized in the statement of
operations, thus establishing a new cost basis for such investment. We evaluate our marketable investment securities
portfolio on a quarterly basis to determine whether declines in the fair market value of these securities are other than
temporary. This quarterly evaluation consists of reviewing, among other things, the fair market value of our marketable