Dish Network 2003 Annual Report Download - page 36
Download and view the complete annual report
Please find page 36 of the 2003 Dish Network annual report below. You can navigate through the pages in the report by either clicking on the pages listed below, or by using the keyword search tool below to find specific information within the annual report.-
 1
1 -
2
-
3
-
4
-
5
-
6
-
7
-
8
-
9
-
10
-
11
-
12
-
13
-
14
-
15
-
16
-
17
-
18
-
19
-
20
-
21
-
22
-
23
-
24
-
25
-
 26
26 -
 27
27 -
 28
28 -
 29
29 -
 30
30 -
 31
31 -
 32
32 -
 33
33 -
 34
34 -
 35
35 -
 36
36 -
 37
37 -
 38
38 -
 39
39 -
 40
40 -
 41
41 -
 42
42 -
 43
43 -
 44
44 -
 45
45 -
 46
46 -
47
-
48
-
49
-
50
-
51
-
52
-
53
-
54
-
55
-
56
-
57
-
58
-
59
-
60
-
61
-
62
-
63
-
64
-
65
-
66
-
67
-
68
-
69
-
70
-
71
-
72
-
73
-
74
-
75
-
76
-
77
-
78
-
79
-
80
-
81
-
82
-
83
-
84
-
85
-
86
-
87
-
88
-
89
-
90
-
91
-
92
-
93
-
94
-
95
-
96
-
97
-
98
-
99
-
100
-
101
-
102
-
103
-
104
-
105
-
106
-
107
-
108
-
109
-
110
-
111
-
112
-
113
-
114
-
115
-
116
-
117
-
118
-
119
-
120
 |
 |

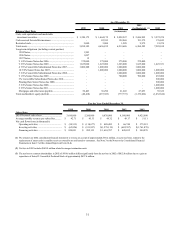
31
As of December 31,
2002
1999 2000 2001 (As Restated) (1) 2003
Balance Sheet Data
(in thousands)
Cash, cash equivalents and marketable
investment securities............................................................ 1,254,175$ 1,464,175$ 2,828,297$ 2,686,995$ 3,972,974$
Cash reserved for satellite insurance...................................... - 82,393 122,068 151,372 176,843
Restricted cash....................................................................... 3,000 3,000 1,288 9,972 19,974
Total assets............................................................................. 3,898,189 4,636,835 6,519,686 6,260,585 7,585,018
Long-term obligations (including current portion):
1994 Notes........................................................................ 1,503 - - - -
1996 Notes........................................................................ 1,097 - - - -
1997 Notes........................................................................ 15 - - - -
9 1/4% Senior Notes due 2006.......................................... 375,000 375,000 375,000 375,000 -
9 3/8% Senior Notes due 2009.......................................... 1,625,000 1,625,000 1,625,000 1,625,000 1,423,351
4 7/8% Convertible Subordinated Notes due 2007........... 1,000,000 1,000,000 1,000,000 1,000,000 -
10 3/8% Senior Notes due 2007........................................ - 1,000,000 1,000,000 1,000,000 1,000,000
5 3/4% Convertible Subordinated Notes due 2008........... - - 1,000,000 1,000,000 1,000,000
9 1/8% Senior Notes due 2009.......................................... - - 700,000 700,000 455,000
3% Convertible Subordinated Notes due 2010................. - - - - 500,000
Floating Rate Senior Notes due 2008................................ - - - - 500,000
5 3/4% Senior Notes due 2008.......................................... - - - - 1,000,000
6 3/8% Senior Notes due 2011.......................................... - - - - 1,000,000
Mortgages and other notes payable................................... 50,403 36,290 21,602 47,053 59,322
Total stockholders' equity (deficit)......................................... (48,418) (657,383) (777,772) (1,176,022) (1,032,524)
For the Year Ended December 31,
1999 2000 2001 2002 2003
Other Data
DISH Network subscribers................................. 3,410,000 5,260,000 6,830,000 8,180,000 9,425,000
Average monthly revenue per subscriber........... 42.71$ 45.33$ 49.32$ 49.17$ 51.11$
Net cash flows from (in thousands):
Operating activities ...................................... (58,513)$ (118,677)$ 489,483$ 66,744$ 575,581$
Investing activities ........................................ (62,826)$ (911,957)$ (1,279,119)$ (682,387)$ (1,761,870)$
Financing activities ...................................... 920,091$ 982,153$ 1,610,707$ 420,832$ 994,070$
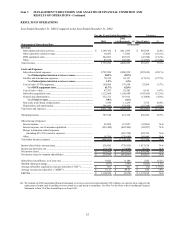
(1) We restated our 2002 consolidated financial statements to reverse an accrual of approximately $30.2 million, on a pre-tax basis, related to the
replacement of smart cards in satellite receivers owned by us and leased to consumers. See Note 3 to the Notes to the Consolidated Financial
Statements in Item 15 of this Annual Report on Form 10-K.
(2) Net loss in 2002 includes $689.8 million related to merger termination costs.
(3) The net loss to common shareholders in 2002 of $414.6 million differs significantly from the net loss in 2002 of $852.0 million due to a gain on
repurchase of Series D Convertible Preferred Stock of approximately $437.4 million.