Dish Network 2003 Annual Report Download - page 40
Download and view the complete annual report
Please find page 40 of the 2003 Dish Network annual report below. You can navigate through the pages in the report by either clicking on the pages listed below, or by using the keyword search tool below to find specific information within the annual report.-
 1
1 -
2
-
3
-
4
-
5
-
6
-
7
-
8
-
9
-
10
-
11
-
12
-
13
-
14
-
15
-
16
-
17
-
18
-
19
-
20
-
21
-
22
-
23
-
24
-
25
-
26
-
27
-
28
-
29
-
 30
30 -
 31
31 -
 32
32 -
 33
33 -
 34
34 -
 35
35 -
 36
36 -
 37
37 -
 38
38 -
 39
39 -
 40
40 -
 41
41 -
 42
42 -
 43
43 -
 44
44 -
 45
45 -
 46
46 -
 47
47 -
 48
48 -
 49
49 -
 50
50 -
51
-
52
-
53
-
54
-
55
-
56
-
57
-
58
-
59
-
60
-
61
-
62
-
63
-
64
-
65
-
66
-
67
-
68
-
69
-
70
-
71
-
72
-
73
-
74
-
75
-
76
-
77
-
78
-
79
-
80
-
81
-
82
-
83
-
84
-
85
-
86
-
87
-
88
-
89
-
90
-
91
-
92
-
93
-
94
-
95
-
96
-
97
-
98
-
99
-
100
-
101
-
102
-
103
-
104
-
105
-
106
-
107
-
108
-
109
-
110
-
111
-
112
-
113
-
114
-
115
-
116
-
117
-
118
-
119
-
120
 |
 |

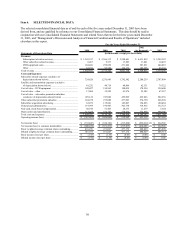
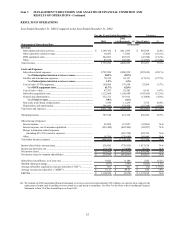
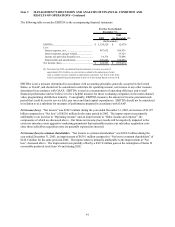
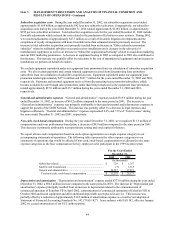
Item 7. MANAGEMENT’S DISCUSSION AND ANALYSIS OF FINANCIAL CONDITION AND
RESULTS OF OPERATIONS - Continued
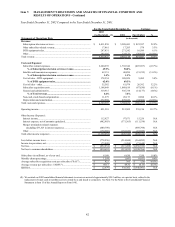
35
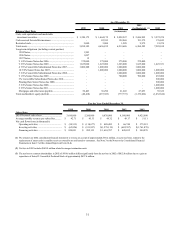
RESULTS OF OPERATIONS
Year Ended December 31, 2003 Compared to the Year Ended December 31, 2002.
For the Years Ended December 31, Variance
2002
2003 (As Restated) (1) Fav/(Unfav) %
Statements of Operations Data (in thousands)
Revenue:
Subscription television services............................................................. 5,399,382$ 4,411,838$ 987,544$ 22.4%
Other subscriber-related revenue............................................................ 10,493 17,861 (7,368) (41.3%)
DTH equipment sales............................................................................. 244,083 287,831 (43,748) (15.2%)
Other....................................................................................................... 85,338 103,295 (17,957) (17.4%)
Total revenue............................................................................................. 5,739,296 4,820,825 918,471 19.1%
Costs and Expenses:
Subscriber-related expenses................................................................... 2,707,898 2,200,239 (507,659) (23.1%)
% of Subscription television services revenue............................ 50.2% 49.9%
Satellite and transmission expenses........................................................ 79,322 62,131 (17,191) (27.7%)
% of Subscription television services revenue............................ 1.5% 1.4%
Cost of sales - DTH equipment.............................................................. 150,600 178,554 27,954 15.7%
% of DTH equipment sales........................................................... 61.7% 62.0%
Cost of sales - other................................................................................ 47,387 55,582 8,195 14.7%
Subscriber acquisition costs................................................................... 1,312,068 1,168,649 (143,419) (12.3%)
General and administrative..................................................................... 332,723 319,915 (12,808) (4.0%)
% of Total revenue........................................................................ 5.8% 6.6%
Non-cash, stock-based compensation..................................................... 3,544 11,279 7,735 68.6%
Depreciation and amortization............................................................... 398,206 372,958 (25,248) (6.8%)
Total costs and expenses........................................................................... 5,031,748 4,369,307 (662,441) (15.2%)
Operating income...................................................................................... 707,548 451,518 256,030 56.7%
Other Income (Expense):
Interest income....................................................................................... 65,058 112,927 (47,869) N/A
Interest expense, net of amounts capitalized.......................................... (552,490) (482,903) (69,587) N/A
Merger termination related expenses
(including $33,323 in interest expense)............................................. - (689,798) 689,798 N/A
Other....................................................................................................... 18,766 (170,680) 189,446 N/A
Total other income (expense).................................................................... (468,666) (1,230,454) 761,788 N/A
Income (loss) before income taxes............................................................ 238,882 (778,936) 1,017,818 N/A
Income tax provision, net.......................................................................... (14,376) (73,098) 58,722 N/A
Net income (loss)...................................................................................... 224,506$ (852,034)$ 1,076,540$ N/A
Net income (loss) to common shareholders............................................... 224,506$ (414,601)$ 639,107 N/A
Subscribers (in millions), as of year end................................................... 9.425 8.180 1.245 15.2%
Monthly churn percentage......................................................................... 1.57% 1.59% 0.02% 1.3%
Average subscriber acquisition costs per subscriber ("SAC")................... 453$ 421$ (32)$ (7.6%)
Average revenue per subscriber ("ARPU").............................................. 51.11$ 49.17$ 1.94$ 3.9%
EBITDA.................................................................................................... 1,124,520$ (2,679)$ 1,127,199$ N/A
(1) We restated our 2002 consolidated financial statements to reverse an accrual of approximately $30.2 million, on a pre-tax basis, related to the
replacement of smart cards in satellite receivers owned by us and leased to consumers. See Note 3 to the Notes to the Consolidated Financial
Statements in Item 15 of this Annual Report on Form 10-K.