Dish Network 2003 Annual Report Download - page 35
Download and view the complete annual report
Please find page 35 of the 2003 Dish Network annual report below. You can navigate through the pages in the report by either clicking on the pages listed below, or by using the keyword search tool below to find specific information within the annual report.-
 1
1 -
2
-
3
-
4
-
5
-
6
-
7
-
8
-
9
-
10
-
11
-
12
-
13
-
14
-
15
-
16
-
17
-
18
-
19
-
20
-
21
-
22
-
23
-
24
-
 25
25 -
 26
26 -
 27
27 -
 28
28 -
 29
29 -
 30
30 -
 31
31 -
 32
32 -
 33
33 -
 34
34 -
 35
35 -
 36
36 -
 37
37 -
 38
38 -
 39
39 -
 40
40 -
 41
41 -
 42
42 -
 43
43 -
 44
44 -
 45
45 -
46
-
47
-
48
-
49
-
50
-
51
-
52
-
53
-
54
-
55
-
56
-
57
-
58
-
59
-
60
-
61
-
62
-
63
-
64
-
65
-
66
-
67
-
68
-
69
-
70
-
71
-
72
-
73
-
74
-
75
-
76
-
77
-
78
-
79
-
80
-
81
-
82
-
83
-
84
-
85
-
86
-
87
-
88
-
89
-
90
-
91
-
92
-
93
-
94
-
95
-
96
-
97
-
98
-
99
-
100
-
101
-
102
-
103
-
104
-
105
-
106
-
107
-
108
-
109
-
110
-
111
-
112
-
113
-
114
-
115
-
116
-
117
-
118
-
119
-
120
 |
 |

30
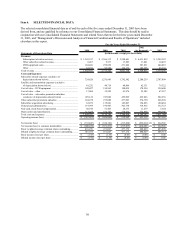
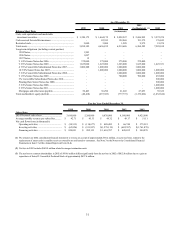
Item 6. SELECTED FINANCIAL DATA
The selected consolidated financial data as of and for each of the five years ended December 31, 2003 have been
derived from, and are qualified by reference to our Consolidated Financial Statements. This data should be read in
conjunction with our Consolidated Financial Statements and related Notes thereto for the three years ended December
31, 2003, and “Management’s Discussion and Analysis of Financial Condition and Results of Operations” included
elsewhere in this report.
For the Years Ended December 31,
2002
1999 2000 2001 (As Restated) (1) 2003
Statements of Operations Data (in thousands, except per share data)
Revenue:
Subscription television services.......................................... 1,345,357$ 2,366,313$ 3,588,441$ 4,411,838$ 5,399,382$
Other subscriber-related revenue......................................... 8,467 5,537 17,283 17,861 10,493
DTH equipment sales.......................................................... 184,041 259,830 271,242 287,831 244,083
Other .................................................................................. 64,976 83,540 124,172 103,295 85,338
Total revenue ......................................................................... 1,602,841 2,715,220 4,001,138 4,820,825 5,739,296
Costs and Expenses:
Subscriber related expenses (exclusive of
depreciation shown below).................................................. 724,620 1,276,943 1,792,542 2,200,239 2,707,898
Satellite and transmission expenses (exclusive
of depreciation shown below)............................................. 41,232 44,719 40,899 62,131 79,322
Cost of sales – DTH equipment ............................................ 148,427 194,963 188,039 178,554 150,600
Cost of sales – other .............................................................. 17,084 32,992 81,974 55,582 47,387
Cost of sales – subscriber promotion subsidies
(exclusive of depreciation shown below) ........................... 478,122 747,020 459,909 439,863 502,656
Other subscriber promotion subsidies ................................... 184,238 273,080 477,903 574,750 628,928
Subscriber acquisition advertising ......................................... 62,072 135,841 143,007 154,036 180,484
General and administrative .................................................... 119,999 196,907 305,738 319,915 332,723
Non-cash, stock-based compensation .................................... 60,910 51,465 20,173 11,279 3,544
Depreciation and amortization............................................... 113,228 185,356 278,652 372,958 398,206
Total costs and expenses ...................................................... 1,949,932 3,139,286 3,788,836 4,369,307 5,031,748
Operating income (loss) ........................................................ (347,091)$ (424,066)$ 212,302$ 451,518$ 707,548$
Net income (loss) ................................................................. (792,847)$ (650,326)$ (215,498)$ (852,034)$ (2) 224,506$
Net income (loss) to common shareholders .......................... (800,100)$ (651,472)$ (215,835)$ (414,601)$ (3) 224,506$
Basic weighted-average common shares outstanding............. 416,476 471,023 477,172 480,429 483,098
Diluted weighted-average common shares outstanding.......... 416,476 471,023 477,172 480,429 488,314
Basic income (loss) per share ................................................ (1.92)$ (1.38)$ (0.45)$ (0.86)$ 0.46$
Diluted income (loss) per share ............................................. (1.92)$ (1.38)$ (0.45)$ (0.86)$ 0.46$