Dish Network 2003 Annual Report Download - page 48
Download and view the complete annual report
Please find page 48 of the 2003 Dish Network annual report below. You can navigate through the pages in the report by either clicking on the pages listed below, or by using the keyword search tool below to find specific information within the annual report.-
 1
1 -
2
-
3
-
4
-
5
-
6
-
7
-
8
-
9
-
10
-
11
-
12
-
13
-
14
-
15
-
16
-
17
-
18
-
19
-
20
-
21
-
22
-
23
-
24
-
25
-
26
-
27
-
28
-
29
-
30
-
31
-
32
-
33
-
34
-
35
-
36
-
37
-
 38
38 -
 39
39 -
 40
40 -
 41
41 -
 42
42 -
 43
43 -
 44
44 -
 45
45 -
 46
46 -
 47
47 -
 48
48 -
 49
49 -
 50
50 -
 51
51 -
 52
52 -
 53
53 -
 54
54 -
 55
55 -
 56
56 -
 57
57 -
 58
58 -
59
-
60
-
61
-
62
-
63
-
64
-
65
-
66
-
67
-
68
-
69
-
70
-
71
-
72
-
73
-
74
-
75
-
76
-
77
-
78
-
79
-
80
-
81
-
82
-
83
-
84
-
85
-
86
-
87
-
88
-
89
-
90
-
91
-
92
-
93
-
94
-
95
-
96
-
97
-
98
-
99
-
100
-
101
-
102
-
103
-
104
-
105
-
106
-
107
-
108
-
109
-
110
-
111
-
112
-
113
-
114
-
115
-
116
-
117
-
118
-
119
-
120
 |
 |
Item 7. MANAGEMENT’S DISCUSSION AND ANALYSIS OF FINANCIAL CONDITION AND
RESULTS OF OPERATIONS - Continued
43
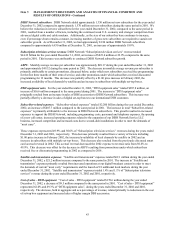
DISH Network subscribers. DISH Network added approximately 1.350 million net new subscribers for the year ended
December 31, 2002 compared to approximately 1.570 million net new subscribers during the same period in 2001. We
believe the reduction in net new subscribers for the year ended December 31, 2002, compared to the same period in
2001, resulted from a number of factors, including the continued weak U.S. economy and stronger competition from
advanced digital cable and cable modems. Additionally, as the size of our subscriber base continues to increase,
even if percentage churn remains constant, increasing numbers of gross new subscribers are required to sustain net
subscriber growth. As of December 31, 2002, we had approximately 8.180 million DISH Network subscribers
compared to approximately 6.830 million at December 31, 2001, an increase of approximately 19.8%.
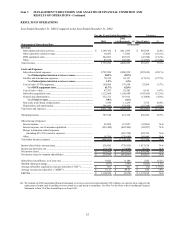
Subscription television services revenue. DISH Network “Subscription television services” revenue totaled
$4.412 billion for the year ended December 31, 2002, an increase of $823.4 million or 22.9% compared to the same
period in 2001. This increase was attributable to continued DISH Network subscriber growth.
ARPU. Monthly average revenue per subscriber was approximately $49.17 during the year ended December 31, 2002
and approximately $49.32 during the same period in 2001. The decrease in monthly average revenue per subscriber is
primarily attributable to certain promotions, discussed below, under which new subscribers received free programming
for the first three months of their term of service, and other promotions under which subscribers received discounted
programming for 12 months. This decrease was partially offset by a $1.00 price increase in February 2002, the
increased availability of local channels by satellite and an increase in subscribers with multiple set-top boxes.
DTH equipment sales. For the year ended December 31, 2002, “DTH equipment sales” totaled $287.8 million, an
increase of $16.6 million compared to the same period during 2001. The increase in “DTH equipment sales”
principally resulted from an increase in sales of DBS accessories to DISH Network subscribers. This increase was
partially offset by a decrease in sales of digital set-top boxes to our international DTH customers.
Subscriber-related expenses. “Subscriber-related expenses” totaled $2.200 billion during the year ended December,
2002, an increase of $407.7 million compared to the same period in 2001. The increase in total “Subscriber-related
expenses” is primarily attributable to the increase in DISH Network subscribers. This growth resulted in increased
expenses to support the DISH Network, including programming costs, personnel and telephone expenses, the opening
of a new call center, increased operating expenses related to the expansion of our DISH Network Service LLC
business, increased competition and increased costs due to second-dish installations in order to meet the demands of
“must carry”.
These expenses represented 49.9% and 50.0% of “Subscription television services” revenues during the years ended
December 31, 2002 and 2001, respectively. This decrease primarily resulted from a variety of factors including
$1.00 price increase in February 2002, the increased availability of local channels by satellite in 2002 and an
increase in subscribers with multiple set-top boxes. This decrease also resulted from the previously discussed smart
card accrual reversal in 2002. This accrual reversal decreased the 2002 expense to revenue ratio from 50.6% to
49.9%. This decrease was offset by the decrease in ARPU resulting from promotions under which subscribers
received free or discounted programming in 2002 as compared to 2001.
Satellite and transmission expenses. “Satellite and transmission” expenses totaled $62.1 million during the year ended
December 31, 2002, a $21.2 million increase compared to the same period in 2001. The increase in “Satellite and
transmission” expenses primarily resulted from increased operations at our digital broadcast centers in order to meet
the demands of current “must carry” requirements and the launch of 18 additional local markets during the year
ended December 31, 2002. “Satellite and transmission” expenses totaled 1.4% and 1.1% of “Subscription television
services” revenue during the years ended December 31, 2002 and 2001, respectively.
Cost of sales – DTH equipment. “Cost of sales – DTH equipment” totaled $178.6 million during the year ended
December 31, 2002, a decrease of $9.5 million compared to the same period in 2001. “Cost of sales - DTH equipment”
represented 62.0% and 69.3% of “DTH equipment sales”, during the years ended December 31, 2002 and 2001,
respectively. The decrease, both in aggregate and as a percentage of revenue, related primarily to reductions in the cost
of set-top box equipment and increased sales of higher margin DBS accessories.