Dish Network 2003 Annual Report Download - page 51
Download and view the complete annual report
Please find page 51 of the 2003 Dish Network annual report below. You can navigate through the pages in the report by either clicking on the pages listed below, or by using the keyword search tool below to find specific information within the annual report.-
 1
1 -
2
-
3
-
4
-
5
-
6
-
7
-
8
-
9
-
10
-
11
-
12
-
13
-
14
-
15
-
16
-
17
-
18
-
19
-
20
-
21
-
22
-
23
-
24
-
25
-
26
-
27
-
28
-
29
-
30
-
31
-
32
-
33
-
34
-
35
-
36
-
37
-
38
-
39
-
40
-
 41
41 -
 42
42 -
 43
43 -
 44
44 -
 45
45 -
 46
46 -
 47
47 -
 48
48 -
 49
49 -
 50
50 -
 51
51 -
 52
52 -
 53
53 -
 54
54 -
 55
55 -
 56
56 -
 57
57 -
 58
58 -
 59
59 -
 60
60 -
 61
61 -
62
-
63
-
64
-
65
-
66
-
67
-
68
-
69
-
70
-
71
-
72
-
73
-
74
-
75
-
76
-
77
-
78
-
79
-
80
-
81
-
82
-
83
-
84
-
85
-
86
-
87
-
88
-
89
-
90
-
91
-
92
-
93
-
94
-
95
-
96
-
97
-
98
-
99
-
100
-
101
-
102
-
103
-
104
-
105
-
106
-
107
-
108
-
109
-
110
-
111
-
112
-
113
-
114
-
115
-
116
-
117
-
118
-
119
-
120
 |
 |
Item 7. MANAGEMENT’S DISCUSSION AND ANALYSIS OF FINANCIAL CONDITION AND
RESULTS OF OPERATIONS - Continued
46
Net loss to common shareholders. “Net loss to common shareholders” was $414.6 million during the year ended
December 31, 2002, an increase of $198.8 million compared to “Net loss to common shareholders” of $215.8 million
for the same period in 2001. The increase is primarily attributable to the increase in “Net loss”, discussed above. The
increase was partially offset by a $437.4 million gain on the redemption of Series D convertible preferred stock from
Vivendi.
LIQUIDITY AND CAPITAL RESOURCES
Our sources of liquidity during 2003 were cash generated from operating activities and proceeds from the July and
October issuances of long-term debt. Proceeds from these issuances were used, in part, to repay higher interest long-
term notes. See further discussion of 2003 financings in “Cash flows from financing activities” below.
We expect that our future working capital, capital expenditure and debt service requirements will be satisfied primarily
from existing cash and investment balances and cash generated from operations. Our ability to generate positive future
operating and net cash flows is dependent upon, among other things, our ability to retain existing DISH Network
subscribers. There can be no assurance that we will be successful in achieving any or all of our goals. The amount of
capital required to fund our 2004 working capital and capital expenditure needs will vary, depending, among other
things, on the rate at which we acquire new subscribers and the cost of subscriber acquisition and retention, including
capitalized costs associated with our equipment lease promotion. The amount of capital required in 2004 will also
depend on our levels of investment in infrastructure necessary to support additional local markets and broadband and
other initiatives. We currently anticipate that 2004 capital expenditures will be significantly higher than 2003 capital
expenditures of $321.8 million. Our capital expenditures will also vary depending on the number of satellites under
construction at any point in time. Our working capital and capital expenditure requirements could increase materially
in the event of increased competition for subscription television customers, significant satellite failures, or in the event
of continued general economic downturn, among other factors. These factors could require that we raise additional
capital in the future. The following discussion highlights our free cash flow and cash flow activities during the years
ended December 31, 2003, 2002 and 2001.
Cash, cash equivalents and marketable investment securities. We consider all liquid investments purchased within
90 days of their maturity to be cash equivalents. See “Item 7A. – Quantitative and Qualitative Disclosures About
Market Risk” for further discussion regarding our marketable investment securities. As of December 31, 2003, our
restricted and unrestricted cash, cash equivalents and marketable investment securities totaled $4.170 billion,
including $176.8 million of cash reserved for satellite insurance and approximately $20.0 million of other restricted
cash and marketable investment securities, compared to $2.848 billion, including $151.4 million of cash reserved for
satellite insurance and $10.0 million of other restricted cash, as of December 31, 2002. As previously discussed,
effective February 2, 2004, EDBS redeemed the remainder of its 9 3/8% Senior Notes due 2009 and, as such, EDBS
has been discharged and released from their obligations under the related indenture. This redemption reduced our
unrestricted cash by approximately $1.490 billion. As an indirect result of this redemption, during February 2004,
we were able to reclassify approximately $57.2 million representing the depreciated cost of two of our satellites
from cash reserved for satellite insurance to cash and cash equivalents.
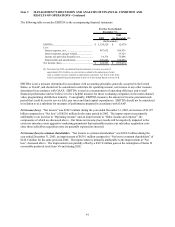
Free Cash Flow. We believe free cash flow is an important liquidity metric because it measures, during a given
period, the amount of cash generated that is available for debt obligations and investments other than purchases of
property and equipment. Free cash flow is not a measure determined in accordance with GAAP and should not be
considered a substitute for “Operating income”, “Net income”, “Net cash flows from operating activities” or any
other measure determined in accordance with GAAP. We believe this non-GAAP liquidity measure is useful in
addition to the most directly comparable GAAP measure of “Net cash flows from operating activities” because free
cash flow includes investments in operational assets. Free cash flow does not represent residual cash available for
discretionary expenditures, since it excludes cash required for debt service. Free cash flow also excludes cash which
may be necessary for acquisitions, investments and other needs that may arise.
Free cash flow was $253.8 million, negative $369.1 million and negative $148.0 million for the years ended December
31, 2003, 2002 and 2001, respectively. The increase from 2002 to 2003 of approximately $622.8 million resulted from
an increase in “Net cash flows from operating activities” of approximately $508.8 million and a decrease in “Purchases
of property and equipment” of approximately $114.0 million. The increase in “Net cash flows from operating
activities” is primarily attributable to an improvement in net income, as discussed in Management’s Discussion and