Dish Network 2003 Annual Report Download - page 50
Download and view the complete annual report
Please find page 50 of the 2003 Dish Network annual report below. You can navigate through the pages in the report by either clicking on the pages listed below, or by using the keyword search tool below to find specific information within the annual report.-
 1
1 -
2
-
3
-
4
-
5
-
6
-
7
-
8
-
9
-
10
-
11
-
12
-
13
-
14
-
15
-
16
-
17
-
18
-
19
-
20
-
21
-
22
-
23
-
24
-
25
-
26
-
27
-
28
-
29
-
30
-
31
-
32
-
33
-
34
-
35
-
36
-
37
-
38
-
39
-
 40
40 -
 41
41 -
 42
42 -
 43
43 -
 44
44 -
 45
45 -
 46
46 -
 47
47 -
 48
48 -
 49
49 -
 50
50 -
 51
51 -
 52
52 -
 53
53 -
 54
54 -
 55
55 -
 56
56 -
 57
57 -
 58
58 -
 59
59 -
 60
60 -
61
-
62
-
63
-
64
-
65
-
66
-
67
-
68
-
69
-
70
-
71
-
72
-
73
-
74
-
75
-
76
-
77
-
78
-
79
-
80
-
81
-
82
-
83
-
84
-
85
-
86
-
87
-
88
-
89
-
90
-
91
-
92
-
93
-
94
-
95
-
96
-
97
-
98
-
99
-
100
-
101
-
102
-
103
-
104
-
105
-
106
-
107
-
108
-
109
-
110
-
111
-
112
-
113
-
114
-
115
-
116
-
117
-
118
-
119
-
120
 |
 |

Item 7. MANAGEMENT’S DISCUSSION AND ANALYSIS OF FINANCIAL CONDITION AND
RESULTS OF OPERATIONS - Continued
45
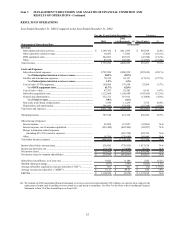
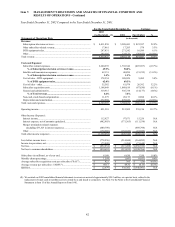
Other income and expense. “Other expense,” net, totaled $1.230 billion during the year ended December 31, 2002, an
increase of $804.1 million compared to the same period in 2001. This increase is primarily attributable to costs
expensed upon termination of the merger of approximately $689.8 million, which consist of a $600.0 million
termination fee paid to Hughes, $56.5 million of previously capitalized merger costs and $33.3 million of fees paid in
connection with merger financing activities. The increase also resulted from an increase in “Other” related to net losses
on marketable and non-marketable investment securities of approximately $135.6 million recorded in 2002 compared
to approximately $110.5 million recorded in 2001 and net charges of approximately $19.7 million relating to the
Vivendi contingent value rights which were outstanding during a portion of 2002. The increase in “Other expense”
was partially offset by a decrease in equity losses of affiliates. “Interest expense, net of amounts capitalized” increased
as a result of the issuance of our 9 1/8% Senior Notes in December 2001, the issuance of our 5 3/4% Convertible
Subordinated Notes in May 2001 and interest costs related to our merger financing activities. “Interest income”
increased as a result of higher cash balances in 2002 as compared to 2001.
Earnings Before Interest, Taxes, Depreciation and Amortization. EBITDA was a negative $2.7 million during the
year ended December 31, 2002, compared to $338.3 million during the same period in 2001. This decrease was mainly
attributable to the merger related expenses recorded in 2002 offset by an increase in the number of DISH Network
subscribers, resulting in recurring revenue which was large enough to support the cost of new and existing subscribers,
together with the introduction of our equipment lease promotion in July 2000. EBITDA does not include the impact
of amounts capitalized under our equipment lease promotion of approximately $277.6 million and $337.7 million
during 2002 and 2001, respectively.
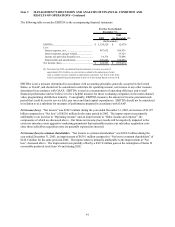
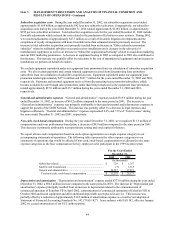
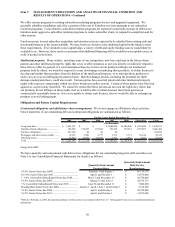
The following table reflects the reconciliation of EBITDA to the accompanying financial statements:
For the Years Ended
December 31,
2002
(As Restated) (1) 2001
(In thousands)
EBITDA................................................................ (2,679)$ 338,302$
Less:
Interest expense, net ........................................... 369,976 273,694
Interest expense, merger related.......................... 33,323 -
Income tax provision (benefit), net...................... 73,098 1,454
Depreciation and amortization............................ 372,958 278,652
Net income (loss).................................................. (852,034)$ (215,498)$
(1) We restated our 2002 consolidated financial statements to reverse an accrual of
approximately $30.2 million, on a pre-tax basis, related to the replacement of smart
cards in satellite receivers owned by us and leased to consumers. See Note 3 to the Notes
to the Consolidated Financial Statements in Item 15 of this Annual Report on Form 10-K.
EBITDA is not a measure determined in accordance with accounting principles generally accepted in the United
States, or GAAP, and should not be considered a substitute for operating income, net income or any other measure
determined in accordance with GAAP. EBITDA is used as a measurement of operating efficiency and overall
financial performance and we believe it to be a helpful measure for those evaluating companies in the multi-channel
video programming distribution industry. Conceptually, EBITDA measures the amount of income generated each
period that could be used to service debt, pay taxes and fund capital expenditures. EBITDA should not be considered
in isolation or as a substitute for measures of performance prepared in accordance with GAAP.
Net loss. “Net loss” was $852.0 million during the year ended December 31, 2002, an increase of $636.5 million
compared to “Net loss” of $215.5 million for the same period in 2001. The increase was primarily attributable to an
increase in “Other income (expense)” discussed above. The increase in net loss was partially offset by an improvement
in “Operating income (loss),” the components of which are discussed above.