Dish Network 2003 Annual Report Download - page 52
Download and view the complete annual report
Please find page 52 of the 2003 Dish Network annual report below. You can navigate through the pages in the report by either clicking on the pages listed below, or by using the keyword search tool below to find specific information within the annual report.-
 1
1 -
2
-
3
-
4
-
5
-
6
-
7
-
8
-
9
-
10
-
11
-
12
-
13
-
14
-
15
-
16
-
17
-
18
-
19
-
20
-
21
-
22
-
23
-
24
-
25
-
26
-
27
-
28
-
29
-
30
-
31
-
32
-
33
-
34
-
35
-
36
-
37
-
38
-
39
-
40
-
41
-
 42
42 -
 43
43 -
 44
44 -
 45
45 -
 46
46 -
 47
47 -
 48
48 -
 49
49 -
 50
50 -
 51
51 -
 52
52 -
 53
53 -
 54
54 -
 55
55 -
 56
56 -
 57
57 -
 58
58 -
 59
59 -
 60
60 -
 61
61 -
 62
62 -
63
-
64
-
65
-
66
-
67
-
68
-
69
-
70
-
71
-
72
-
73
-
74
-
75
-
76
-
77
-
78
-
79
-
80
-
81
-
82
-
83
-
84
-
85
-
86
-
87
-
88
-
89
-
90
-
91
-
92
-
93
-
94
-
95
-
96
-
97
-
98
-
99
-
100
-
101
-
102
-
103
-
104
-
105
-
106
-
107
-
108
-
109
-
110
-
111
-
112
-
113
-
114
-
115
-
116
-
117
-
118
-
119
-
120
 |
 |

Item 7. MANAGEMENT’S DISCUSSION AND ANALYSIS OF FINANCIAL CONDITION AND
RESULTS OF OPERATIONS - Continued
47
Analysis of Financial Condition and Results of Operations, for the year ended December 31, 2003 compared to the
same period in 2002. The improvement in net income was offset by significantly less cash flow generated from
changes in operating assets and liabilities in 2003 as compared to 2002. Cash flow from changes in operating assets
and liabilities was negative $75.7 million during 2003 compared to $183.0 million during 2002. This decrease includes
a $50.0 million satellite prepayment to SES Americom in 2003 that is included in “Other non-current assets” (see Note
10 to the Consolidated Financial Statements for further discussion). This decrease also includes an increased use of
cash related to reductions in accounts payable and accrued expenses as a result of the timing of certain payments. The
decrease in “Purchases of property and equipment” was primarily attributable to reduced spending on the construction
of satellites and the capitalization of less equipment under our lease promotion.
The decrease from 2001 to 2002 of approximately $221.1 million resulted from a decrease in “Net cash flows from
operating activities” of approximately $422.7 million and a decrease in “Purchases of property and equipment” of
approximately $201.6 million. The decrease in “Net cash flows from operating activities” is primarily attributable to an
increase in net losses, as discussed in Management’s Discussion and Analysis of Financial Condition and Results of
Operations, and a decrease in cash flow generated from changes in operating assets and liabilities in 2002 as compared
to 2001. Cash flow from changes in operating assets and liabilities was $183.0 million during 2002 compared to
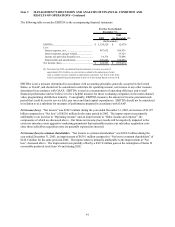
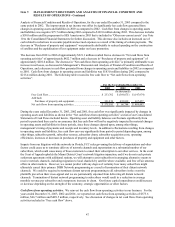
$215.4 million during 2001. The following table reconciles free cash flow to “Net cash flows from operating
activities”.
For the Years Ended December 31,
2003 2002 2001
(In thousands)
Free Cash Flow.............................................................................. 253,762$ (369,075)$ (147,974)$
Add back:
Purchases of property and equipment....................................... 321,819 435,819 637,457
Net cash flows from operating activities........................................ 575,581$ 66,744$ 489,483$
During the years ended December 31, 2003, 2002 and 2001, free cash flow was significantly impacted by changes in
operating assets and liabilities as shown in the “Net cash flows from operating activities” section of our Consolidated
Statements of Cash Flows included herein. Operating asset and liability balances can fluctuate significantly from
period to period and there can be no assurance that free cash flow will not be negatively impacted by material changes
in operating assets and liabilities in future periods, since these changes depend upon, among other things,
management’s timing of payments and receipts and inventory levels. In addition to fluctuations resulting from changes
in operating assets and liabilities, free cash flow can vary significantly from period to period depending upon, among
other things, subscriber growth, subscriber revenue, subscriber churn, subscriber acquisition costs, operating
efficiencies, increases or decreases in purchases of property and equipment and other factors.
Impacts from our litigation with the networks in Florida, FCC rules governing the delivery of superstations and other
factors could cause us to terminate delivery of network channels and superstations to a substantial number of our
subscribers, which could cause many of those customers to cancel their subscription to our other services. In the event
the Court of Appeals upholds the Miami District Court’s network litigation injunction, and if we do not reach private
settlement agreements with additional stations, we will attempt to assist subscribers in arranging alternative means to
receive network channels, including migration to local channels by satellite where available, and free off air antenna
offers in other markets. However, we cannot predict with any degree of certainty how many subscribers might
ultimately cancel their primary DISH Network programming as a result of termination of their distant network
channels. We could be required to terminate distant network programming to all subscribers in the event the
plaintiffs prevail on their cross-appeal and we are permanently enjoined from delivering all distant network
channels. Termination of distant network programming to subscribers would result in a reduction in average
monthly revenue per subscriber and a temporary increase in churn. Our future capital expenditures could increase
or decrease depending on the strength of the economy, strategic opportunities or other factors.
Cash flows from operating activities. We reinvest the cash flow from operating activities in our business. For the
years ended December 31, 2003, 2002 and 2001, we reported net cash flows from operating activities of $575.6
million, $66.7 million and $489.5 million, respectively. See discussion of changes in net cash flows from operating
activities included in “Free cash flow” above.