Dish Network 2003 Annual Report Download - page 111
Download and view the complete annual report
Please find page 111 of the 2003 Dish Network annual report below. You can navigate through the pages in the report by either clicking on the pages listed below, or by using the keyword search tool below to find specific information within the annual report.-
 1
1 -
2
-
3
-
4
-
5
-
6
-
7
-
8
-
9
-
10
-
11
-
12
-
13
-
14
-
15
-
16
-
17
-
18
-
19
-
20
-
21
-
22
-
23
-
24
-
25
-
26
-
27
-
28
-
29
-
30
-
31
-
32
-
33
-
34
-
35
-
36
-
37
-
38
-
39
-
40
-
41
-
42
-
43
-
44
-
45
-
46
-
47
-
48
-
49
-
50
-
51
-
52
-
53
-
54
-
55
-
56
-
57
-
58
-
59
-
60
-
61
-
62
-
63
-
64
-
65
-
66
-
67
-
68
-
69
-
70
-
71
-
72
-
73
-
74
-
75
-
76
-
77
-
78
-
79
-
80
-
81
-
82
-
83
-
84
-
85
-
86
-
87
-
88
-
89
-
90
-
91
-
92
-
93
-
94
-
95
-
96
-
97
-
98
-
99
-
100
-
 101
101 -
 102
102 -
 103
103 -
 104
104 -
 105
105 -
 106
106 -
 107
107 -
 108
108 -
 109
109 -
 110
110 -
 111
111 -
 112
112 -
 113
113 -
 114
114 -
 115
115 -
 116
116 -
 117
117 -
 118
118 -
 119
119 -
 120
120
 |
 |

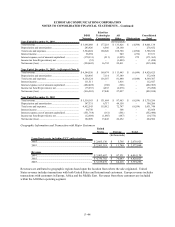
ECHOSTAR COMMUNICATIONS CORPORATION
NOTES TO CONSOLIDATED FINANCIAL STATEMENTS – Continued
F–44
EchoStar
DISH Technologies All Consolidated
Network Corporation Other Eliminations Total
Year Ended December 31, 2001 (In thousands)
Total revenue .................................................................... 3,695,088$ 177,218$ 133,426$ (4,594)$ 4,001,138$
Depreciation and amortization .......................................... 243,926 6,566 28,160 - 278,652
Total costs and expenses ................................................... 3,524,024 160,626 108,780 (4,594) 3,788,836
Interest income .................................................................. 96,994 - 949 (272) 97,671
Interest expense, net of amounts capitalized ..................... (370,331) (211) (1,095) 272 (371,365)
Income tax benefit (provision), net ................................... (51) - (1,403) - (1,454)
Net income (loss) .............................................................. (254,641) 16,732 22,411 - (215,498)
Year Ended December 31, 2002 - As Restated (Note 3)
Total revenue .................................................................... 4,544,550$ 169,674$ 113,445$ (6,844)$ 4,820,825$
Depreciation and amortization .......................................... 328,495 7,114 37,349 - 372,958
Total costs and expenses ................................................... 4,158,324 136,387 81,440 (6,844) 4,369,307
Interest income .................................................................. 111,511 - 1,416 - 112,927
Interest expense, net of amounts capitalized ..................... (482,409) (188) (306) - (482,903)
Income tax benefit (provision), net ................................... (75,253) 4,233 (2,078) - (73,098)
Net income (loss) .............................................................. (916,501) 37,440 27,027 - (852,034)
Year Ended December 31, 2003
Total revenue .................................................................... 5,518,183$ 131,684$ 97,983$ (8,554)$ 5,739,296$
Depreciation and amortization .......................................... 347,331 6,717 44,158 - 398,206
Total costs and expenses ................................................... 4,852,543 115,012 72,747 (8,554) 5,031,748
Interest income .................................................................. 64,750 - 308 - 65,058
Interest expense, net of amounts capitalized ..................... (551,768) (161) (561) - (552,490)
Income tax benefit (provision), net ................................... (12,604) (1,085) (687) - (14,376)
Net income (loss) .............................................................. 182,809 15,445 26,252 - 224,506
Geographic Information and Transaction with Major Customers
United
States Europe Total
(In thousands)
Long-lived assets, including FCC authorizations
2002................................................................................... 2,665,130$ 5,795$ 2,670,925$
2003................................................................................... 2,561,119$ 11,749$ 2,572,868$
Revenue
2001................................................................................... 3,903,607$ 97,531$ 4,001,138$
2002................................................................................... 4,750,782$ 70,043$ 4,820,825$
2003................................................................................... 5,675,078$ 64,218$ 5,739,296$
Revenues are attributed to geographic regions based upon the location from where the sale originated. United
States revenue includes transactions with both United States and International customers. Europe revenue includes
transactions with customers in Europe, Africa and the Middle East. Revenues from these customers are included
within the All Other operating segment.