Dish Network 2003 Annual Report Download - page 74
Download and view the complete annual report
Please find page 74 of the 2003 Dish Network annual report below. You can navigate through the pages in the report by either clicking on the pages listed below, or by using the keyword search tool below to find specific information within the annual report.-
 1
1 -
2
-
3
-
4
-
5
-
6
-
7
-
8
-
9
-
10
-
11
-
12
-
13
-
14
-
15
-
16
-
17
-
18
-
19
-
20
-
21
-
22
-
23
-
24
-
25
-
26
-
27
-
28
-
29
-
30
-
31
-
32
-
33
-
34
-
35
-
36
-
37
-
38
-
39
-
40
-
41
-
42
-
43
-
44
-
45
-
46
-
47
-
48
-
49
-
50
-
51
-
52
-
53
-
54
-
55
-
56
-
57
-
58
-
59
-
60
-
61
-
62
-
63
-
 64
64 -
 65
65 -
 66
66 -
 67
67 -
 68
68 -
 69
69 -
 70
70 -
 71
71 -
 72
72 -
 73
73 -
 74
74 -
 75
75 -
 76
76 -
 77
77 -
 78
78 -
 79
79 -
 80
80 -
 81
81 -
 82
82 -
 83
83 -
 84
84 -
85
-
86
-
87
-
88
-
89
-
90
-
91
-
92
-
93
-
94
-
95
-
96
-
97
-
98
-
99
-
100
-
101
-
102
-
103
-
104
-
105
-
106
-
107
-
108
-
109
-
110
-
111
-
112
-
113
-
114
-
115
-
116
-
117
-
118
-
119
-
120
 |
 |

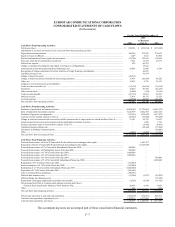
ECHOSTAR COMMUNICATIONS CORPORATION
CONSOLIDATED STATEMENTS OF CASH FLOWS
(In thousands)
The accompanying notes are an integral part of these consolidated financial statements.
F–7
For the Years Ended December 31,
2002
As Restated
2003 (Note 3) 2001
Cash Flows From Operating Activities:
Net income (loss) ....................................................................................................................................................................... 224,506$ (852,034)$ (215,498)$
Adjustments to reconcile net income (loss) to net cash flows from operating activities:
Depreciation and amortization ................................................................................................................................................... 398,206 372,958 278,652
Equity in losses of affiliates ........................................................................................................................................................ 1,649 8,012 34,908
Realized and unrealized losses (gains) on investments .............................................................................................................. (19,784) 135,619 110,458
Non-cash, stock-based compensation recognized ...................................................................................................................... 3,544 11,279 20,173
Deferred tax expense .................................................................................................................................................................. 629 66,703 -
Change in valuation of contingent value rights, net of gain on extinguishment.......................................................................... - 19,645 -
Amortization of debt discount and deferred financing costs ...................................................................................................... 26,685 11,906 9,189
Recognition of bridge commitment fees from reduction of bridge financing commitments........................................................ - 48,435 -
Capitalized merger costs............................................................................................................................................................. - 56,474 -
Change in long-term assets.......................................................................................................................................................... (49,333) - -
Change in long-term deferred distribution and carriage payments.............................................................................................. 11,434 (20,924) 46,282
Other, net .................................................................................................................................................................................... 15,835 4,756 36,179
Changes in current assets and current liabilities:
Trade accounts receivable, net ................................................................................................................................................... (14,178) (10,619) (39,514)
Inventories .................................................................................................................................................................................. 18,020 69,709 (25,247)
Other current assets .................................................................................................................................................................... (6,860) (474) (8,316)
Trade accounts payable .............................................................................................................................................................. (91,176) 18,014 28,233
Deferred revenue ........................................................................................................................................................................ 71,074 84,333 75,529
Accrued expenses ....................................................................................................................................................................... (14,670) 42,952 138,455
Net cash flows from operating activities .................................................................................................................................... 575,581 66,744 489,483
Cash Flows From Investing Activities:
Purchases of marketable investment securities ........................................................................................................................... (5,050,502) (5,770,963) (2,549,179)
Sales of marketable investment securities .................................................................................................................................. 3,641,939 5,602,398 2,023,268
Purchases of property and equipment ......................................................................................................................................... (321,819) (435,819) (637,457)
Cash reserved for satellite insurance (Note 4) ............................................................................................................................ (58,385) (59,680) (59,488)
Change in restricted cash and cash reserved for satellite insurance due to depreciation on related satellites (Note 4)............... 31,381 30,376 19,813
Funds released from escrow and restricted cash and marketable investment securities.............................................................. - 1,288 1,712
Incentive payments under in-orbit satellite contract - Echo VI................................................................................................... - (8,441) (8,441)
Capitalized merger-related costs ................................................................................................................................................ - (38,644) (17,830)
Investment in StarBand Communications .................................................................................................................................. - - (50,000)
Other ........................................................................................................................................................................................... (4,484) (2,902) (1,517)
Net cash flows from investing activities ..................................................................................................................................... (1,761,870) (682,387) (1,279,119)
Cash Flows From Financing Activities:
Proceeds from issuance of Series D Convertible Preferred Stock and contingent value rights................................................... - 1,483,477 -
Repurchase of Series D Convertible Preferred Stock and contingent value rights...................................................................... - (1,065,689) -
Proceeds from issuance of 3% Convertible Subordinated Notes due 2010................................................................................. 500,000 - -
Proceeds from issuance of Floating Rate Senior Notes due 2008............................................................................................... 500,000 - -
Proceeds from issuance of 5 3/4% Senior Notes due 2008......................................................................................................... 1,000,000 - -
Proceeds from issuance of 6 3/8% Senior Notes due 2011......................................................................................................... 1,000,000 - -
Proceeds from issuance of 9 1/8% Senior Notes due 2009 ........................................................................................................ - - 700,000
Proceeds from issuance of 5 3/4% Convertible Subordinated Notes due 2008 .......................................................................... - - 1,000,000
Redemption of 9 1/4% Senior Notes due 2006........................................................................................................................... (375,000) - -
Partial redemption of 9 1/8% Senior Notes due 2009................................................................................................................. (245,000) - -
Redemption of 4 7/8% Convertible Subordinated Notes due 2007............................................................................................. (1,000,000) - -
Repurchase of 9 3/8% Senior Notes due 2009............................................................................................................................ (201,649) - -
Class A Common Stock repurchases........................................................................................................................................... (190,391) - -
Deferred debt issuance costs ...................................................................................................................................................... (12,500) (1,837) (29,450)
Deferred bridge loan financing costs .......................................................................................................................................... - - (55,250)
Repayments of mortgage indebtedness and other notes payable ................................................................................................ (2,329) (4,549) (14,182)
Net proceeds from Class A Common Stock options exercised and Class A
Common Stock issued under Employee Stock Purchase Plan ............................................................................................... 20,438 9,430 9,929
Other ........................................................................................................................................................................................... 501 - (340)
Net cash flows from financing activities .................................................................................................................................... 994,070 420,832 1,610,707
Net increase (decrease) in cash and cash equivalents ................................................................................................................. (192,219) (194,811) 821,071
Cash and cash equivalents, beginning of year ............................................................................................................................ 1,483,078 1,677,889 856,818
Cash and cash equivalents, end of year ...................................................................................................................................... 1,290,859$ 1,483,078$ 1,677,889$