Dish Network 2003 Annual Report Download - page 42
Download and view the complete annual report
Please find page 42 of the 2003 Dish Network annual report below. You can navigate through the pages in the report by either clicking on the pages listed below, or by using the keyword search tool below to find specific information within the annual report.-
 1
1 -
2
-
3
-
4
-
5
-
6
-
7
-
8
-
9
-
10
-
11
-
12
-
13
-
14
-
15
-
16
-
17
-
18
-
19
-
20
-
21
-
22
-
23
-
24
-
25
-
26
-
27
-
28
-
29
-
30
-
31
-
 32
32 -
 33
33 -
 34
34 -
 35
35 -
 36
36 -
 37
37 -
 38
38 -
 39
39 -
 40
40 -
 41
41 -
 42
42 -
 43
43 -
 44
44 -
 45
45 -
 46
46 -
 47
47 -
 48
48 -
 49
49 -
 50
50 -
 51
51 -
 52
52 -
53
-
54
-
55
-
56
-
57
-
58
-
59
-
60
-
61
-
62
-
63
-
64
-
65
-
66
-
67
-
68
-
69
-
70
-
71
-
72
-
73
-
74
-
75
-
76
-
77
-
78
-
79
-
80
-
81
-
82
-
83
-
84
-
85
-
86
-
87
-
88
-
89
-
90
-
91
-
92
-
93
-
94
-
95
-
96
-
97
-
98
-
99
-
100
-
101
-
102
-
103
-
104
-
105
-
106
-
107
-
108
-
109
-
110
-
111
-
112
-
113
-
114
-
115
-
116
-
117
-
118
-
119
-
120
 |
 |
Item 7. MANAGEMENT’S DISCUSSION AND ANALYSIS OF FINANCIAL CONDITION AND
RESULTS OF OPERATIONS - Continued
37
might ultimately cancel their primary DISH Network programming as a result of termination of their distant network
channels. We could be required to terminate distant network programming to all subscribers in the event the
plaintiffs prevail on their cross-appeal and we are permanently enjoined from delivering all distant network
channels. Termination of distant network programming to subscribers would result in a reduction in average
monthly revenue per subscriber and a temporary increase in churn.
In April 2002, the FCC concluded that our “must carry” implementation methods were not in compliance with the
“must carry” rules. If the FCC finds our subsequent remedial actions unsatisfactory, while we would attempt to
continue providing local network channels in all markets without interruption, we could be forced by capacity
constraints to reduce the number of markets in which we provide local channels. This could cause a temporary
increase in churn and a small reduction in average monthly revenue per subscriber.
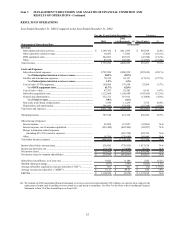
DTH equipment sales. For the year ended December 31, 2003, “DTH equipment sales” totaled $244.1 million, a
decrease of $43.7 million compared to the same period during 2002. The decrease in “DTH equipment sales”
principally resulted from a decline in the number of digital set-top boxes sold to Bell ExpressVu.
We currently have certain binding purchase orders and a minimum volume commitment from Bell ExpressVu for
2004, and we are actively trying to secure new orders from other potential international customers. However, we
cannot guarantee at this time that those negotiations will be successful. A significant portion of our future DTH
equipment revenue depends largely on the success of Bell ExpressVu and other international operators, which in
turn, depends on other factors, such as the level of consumer acceptance of direct-to-home satellite TV products and
the increasing intensity of competition for international subscription television subscribers.
Subscriber-related expenses. “Subscriber-related expenses” totaled $2.708 billion during the year ended December
31, 2003, an increase of $507.7 million or 23.1% compared to the same period in 2002. The increase in “Subscriber-
related expenses” was primarily attributable to the increase in the number of DISH Network subscribers. This growth
resulted in increased expenses to support the DISH Network, including programming costs, personnel expenses, the
opening of a new call center, and increased operating expenses related to the expansion of our DISH Network Service
LLC business. “Subscriber-related expenses” represented 50.2% and 49.9% of “Subscription television services”
revenue during the years ended December 31, 2003 and 2002, respectively. The increase in “Subscriber-related
expenses” as a percentage of “Subscription television services revenue” primarily resulted from the previously
discussed smart card accrual reversal in 2002. This accrual reversal decreased the 2002 expense to revenue ratio
from 50.6% to 49.9%. The increase in the expense to revenue ratio from 2002 to 2003 was partially offset by an
increase in monthly average revenue per subscriber and increased operating efficiencies.
During 2003 and 2002, we offered various programs to existing subscribers including programs for new and
upgraded equipment. We generally subsidize installation and all or a portion of the cost of EchoStar receivers
pursuant to our subscriber retention programs. Costs related to subscriber retention programs are expected to
materially increase in the future as we introduce more aggressive subscriber retention programs to reduce subscriber
churn, to respond to competition and for other reasons.
In the normal course of business, we enter into various contracts with programmers to provide content. Our
programming contracts generally require us to only make payments based on the number of subscribers to which the
respective content is provided. Consequently, our programming expenses will continue to increase to the extent we are
successful growing our subscriber base. In addition, because programmers continue to raise the price of content, there
can be no assurance that our “Subscriber-related expenses” as a percentage of “Subscription television services
revenue” will not materially increase without corresponding price increases in our DISH Network programming
packages.
Satellite and transmission expenses. “Satellite and transmission expenses” totaled $79.3 million during the year ended
December 31, 2003, a $17.2 million increase compared to the same period in 2002. This increase primarily resulted
from launch and operational costs associated with the increasing number of markets in which we offer local network
channels by satellite. During 2003, we launched 47 additional local markets compared to the launch of 18 additional
markets during 2002. “Satellite and transmission expenses” totaled 1.5% and 1.4% of “Subscription television
services” revenue during each of the years ended December 31, 2003 and 2002, respectively. These expenses will
increase further in the future to the extent we successfully obtain commercial in-orbit satellite insurance and to the