Costco 2007 Annual Report Download - page 78
Download and view the complete annual report
Please find page 78 of the 2007 Costco annual report below. You can navigate through the pages in the report by either clicking on the pages listed below, or by using the keyword search tool below to find specific information within the annual report.-
 1
1 -
2
-
3
-
4
-
5
-
6
-
7
-
8
-
9
-
10
-
11
-
12
-
13
-
14
-
15
-
16
-
17
-
18
-
19
-
20
-
21
-
22
-
23
-
24
-
25
-
26
-
27
-
28
-
29
-
30
-
31
-
32
-
33
-
34
-
35
-
36
-
37
-
38
-
39
-
40
-
41
-
42
-
43
-
44
-
45
-
46
-
47
-
48
-
49
-
50
-
51
-
52
-
53
-
54
-
55
-
56
-
57
-
58
-
59
-
60
-
61
-
62
-
63
-
64
-
65
-
66
-
67
-
 68
68 -
 69
69 -
 70
70 -
 71
71 -
 72
72 -
 73
73 -
 74
74 -
 75
75 -
 76
76 -
 77
77 -
 78
78 -
 79
79 -
 80
80 -
 81
81 -
 82
82 -
 83
83 -
 84
84
 |
 |

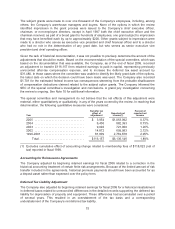
Impact of Adjustments
The impact of each of the items noted above, net of tax, on fiscal 2006 beginning balances is
presented below:
Cumulative Effect as of August 29, 2005
Stock option
grant practices
Income tax
reserve for excess
compensation
Deposit
accounting Deferred taxes Total
Deferred income taxes and
other current assets ..... $ — $ — $16,427 $ — $ 16,427
Other current liabilities ..... — (1,701) — — (1,701)
Deferred income taxes and
other liabilities .......... 31,480 — (6,383) (31,667) (6,570)
Additional paid-in-capital . . . (147,637) — — — (147,637)
Retained earnings ........ 116,157 1,701 (10,044) 31,667 139,481
Total ............... $ — $ — $ — $ — $ —
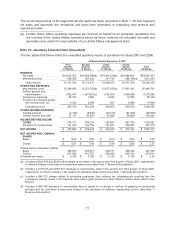
Note 12—Segment Reporting
The Company and its subsidiaries are principally engaged in the operation of membership warehouses
in the United States, Canada, Japan and the United Kingdom and through majority-owned subsidiaries
in Taiwan and Korea and through a 50%-owned joint-venture in Mexico. The Company’s reportable
segments are based on management responsibility. The investment in the Mexico joint-venture is only
included in total assets under United States Operations in the table below, as it is accounted for under
the equity method and its operations are not consolidated in the Company’s financial statements.
United States
Operations(a)
Canadian
Operations
Other
International
Operations Total
Year Ended September 2, 2007
Total revenue ............... $51,532,178 $8,723,562 $4,144,415 $64,400,155
Operating income ............ 1,216,517 287,045 105,024 1,608,586
Depreciation and
amortization ............... 449,338 72,915 44,132 566,385
Capital expenditures .......... 1,104,461 206,840 74,398 1,385,699
Property and equipment ....... 7,357,160 1,237,031 925,589 9,519,780
Total assets ................. 15,543,357 2,279,453 1,783,776 19,606,586
Net assets .................. 6,417,458 1,157,640 1,048,243 8,623,341
Year Ended September 3, 2006
Total revenue ............... $48,465,918 $8,121,728 $3,563,581 $60,151,227
Operating income ............ 1,245,835 292,512 87,285 1,625,632
Depreciation and
amortization ............... 413,235 61,232 40,818 515,285
Capital expenditures .......... 937,275 188,914 90,312 1,216,501
Property and equipment ....... 6,676,417 1,032,439 855,439 8,564,295
Total assets ................. 14,009,262 1,913,945 1,571,863 17,495,070
Net assets .................. 7,189,831 1,043,384 910,224 9,143,439
Year Ended August 28, 2005
Total revenue ............... $43,064,452 $6,732,305 $3,155,469 $52,952,226
Operating income ............ 1,167,736 241,503 65,064 1,474,303
Depreciation and
amortization ............... 389,172 50,938 41,728 481,838
Capital expenditures .......... 730,568 139,735 121,978 992,281
Property and equipment ....... 6,170,553 833,637 786,002 7,790,192
Total assets ................. 13,202,937 2,034,420 1,427,848 16,665,205
Net assets .................. 6,769,222 1,284,829 827,058 8,881,109
76