Costco 2007 Annual Report Download - page 50
Download and view the complete annual report
Please find page 50 of the 2007 Costco annual report below. You can navigate through the pages in the report by either clicking on the pages listed below, or by using the keyword search tool below to find specific information within the annual report.-
 1
1 -
2
-
3
-
4
-
5
-
6
-
7
-
8
-
9
-
10
-
11
-
12
-
13
-
14
-
15
-
16
-
17
-
18
-
19
-
20
-
21
-
22
-
23
-
24
-
25
-
26
-
27
-
28
-
29
-
30
-
31
-
32
-
33
-
34
-
35
-
36
-
37
-
38
-
39
-
 40
40 -
 41
41 -
 42
42 -
 43
43 -
 44
44 -
 45
45 -
 46
46 -
 47
47 -
 48
48 -
 49
49 -
 50
50 -
 51
51 -
 52
52 -
 53
53 -
 54
54 -
 55
55 -
 56
56 -
 57
57 -
 58
58 -
 59
59 -
 60
60 -
61
-
62
-
63
-
64
-
65
-
66
-
67
-
68
-
69
-
70
-
71
-
72
-
73
-
74
-
75
-
76
-
77
-
78
-
79
-
80
-
81
-
82
-
83
-
84
 |
 |

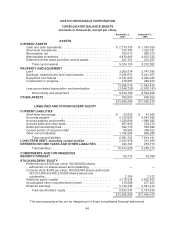
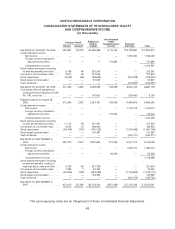
COSTCO WHOLESALE CORPORATION
CONSOLIDATED STATEMENTS OF STOCKHOLDERS’ EQUITY
AND COMPREHENSIVE INCOME
(in thousands)
Common Stock Additional
Paid-In
Capital
Accumulated
Other
Comprehensive
Income
Retained
Earnings TotalShares Amount
BALANCE AT AUGUST 29, 2004 . . . 462,637 $2,313 $1,466,366 $ 16,144 $ 6,139,987 $ 7,624,810
Comprehensive Income:
Net Income .................. — — — — 1,063,092 1,063,092
Foreign currency translation
adjustment and other ........ — — — 141,895 — 141,895
Comprehensive income ........ 1,204,987
Stock options exercised, including
income tax benefits and other ..... 9,138 46 323,545 — — 323,591
Conversion of convertible notes ..... 9,910 49 277,554 — — 277,603
Stock repurchase ................. (9,205) (46) (38,848) — (374,358) (413,252)
Stock-based compensation ......... — — 67,937 — — 67,937
Cash dividends ................... — — — — (204,567) (204,567)
BALANCE AT AUGUST 28, 2005 . . . 472,480 2,362 2,096,554 158,039 6,624,154 8,881,109
Cumulative effect of adjustments
resulting from the adoption of SAB
No. 108, net of tax .............. — — 147,637 — (139,481) 8,156
Adjusted balance at August 28,
2005 .......................... 472,480 2,362 2,244,191 158,039 6,484,673 8,889,265
Comprehensive Income:
Net Income .................. — — — — 1,103,215 1,103,215
Foreign currency translation
adjustment and other ........ — — — 119,224 — 119,224
Comprehensive income ........ 1,222,439
Stock options exercised, including
income tax benefits and other ..... 11,712 59 427,291 — — 427,350
Conversion of convertible notes ..... 6,505 33 188,902 — — 188,935
Stock repurchase ................. (28,418) (142) (145,129) — (1,316,465) (1,461,736)
Stock-based compensation ......... — — 107,397 — — 107,397
Cash dividends ................... — — — — (230,211) (230,211)
BALANCE AT SEPTEMBER 3,
2006 .......................... 462,279 2,312 2,822,652 277,263 6,041,212 9,143,439
Comprehensive Income:
Net Income .................. — — — — 1,082,772 1,082,772
Foreign currency translation
adjustment and other ........ — — — 93,326 — 93,326
Comprehensive income ........ 1,176,098
Stock options exercised, including
income tax benefits, vesting of
restricted stock units and other .... 9,735 48 351,756 — — 351,804
Conversion of convertible notes ..... 1,389 7 42,323 — — 42,330
Stock repurchase ................. (36,390) (182) (233,089) — (1,745,899) (1,979,170)
Stock-based compensation ......... — — 134,582 — — 134,582
Cash dividends ................... — — — — (245,742) (245,742)
BALANCE AT SEPTEMBER 2,
2007 .......................... 437,013 $2,185 $3,118,224 $370,589 $ 5,132,343 $ 8,623,341
The accompanying notes are an integral part of these consolidated financial statements.
48