Costco 2007 Annual Report Download - page 54
Download and view the complete annual report
Please find page 54 of the 2007 Costco annual report below. You can navigate through the pages in the report by either clicking on the pages listed below, or by using the keyword search tool below to find specific information within the annual report.-
 1
1 -
2
-
3
-
4
-
5
-
6
-
7
-
8
-
9
-
10
-
11
-
12
-
13
-
14
-
15
-
16
-
17
-
18
-
19
-
20
-
21
-
22
-
23
-
24
-
25
-
26
-
27
-
28
-
29
-
30
-
31
-
32
-
33
-
34
-
35
-
36
-
37
-
38
-
39
-
40
-
41
-
42
-
43
-
 44
44 -
 45
45 -
 46
46 -
 47
47 -
 48
48 -
 49
49 -
 50
50 -
 51
51 -
 52
52 -
 53
53 -
 54
54 -
 55
55 -
 56
56 -
 57
57 -
 58
58 -
 59
59 -
 60
60 -
 61
61 -
 62
62 -
 63
63 -
 64
64 -
65
-
66
-
67
-
68
-
69
-
70
-
71
-
72
-
73
-
74
-
75
-
76
-
77
-
78
-
79
-
80
-
81
-
82
-
83
-
84
 |
 |

believes the LIFO method more fairly presents the results of operations by more closely matching
current costs with current revenues. The Company records an adjustment each quarter, if necessary,
for the expected annual effect of inflation, and these estimates are adjusted to actual results
determined at year-end. At both September 2, 2007 and September 3, 2006, merchandise inventories
valued at LIFO approximated FIFO after considering the lower of cost or market principle.
September 2,
2007
September 3,
2006
Merchandise inventories consist of:
United States (primarily LIFO) ............. $3,799,999 $3,613,412
Foreign (FIFO) .......................... 1,079,466 947,820
Total .............................. $4,879,465 $4,561,232
The Company provides for estimated inventory losses between physical inventory counts as a
percentage of net sales, using estimates based on the Company’s experience. The provision is
adjusted periodically to reflect the results of the actual physical inventory counts, which generally occur
in the second and fourth fiscal quarters of the fiscal year. Inventory cost, where appropriate, is reduced
by estimates of vendor rebates when earned or as the Company progresses towards earning those
rebates, provided they are probable and reasonably estimable.
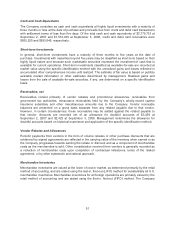
Property and Equipment
Property and equipment are stated at cost. Depreciation and amortization expenses are computed
using the straight-line method. Estimated useful lives by major asset category are as follows:
Years
Buildings ......................................... 5-50
Equipment and fixtures ............................. 3-10
Leasehold improvements ............................ Shorter of useful life or
lease term
Land improvements ................................ 15
Software acquisition and development ................. 3-6
Interest costs incurred on property during the construction period are capitalized. The amount of
interest costs capitalized was $11,423 in fiscal 2007, $12,681 in fiscal 2006, and $7,226 in fiscal 2005.
Impairment of Long-Lived Assets
The Company periodically evaluates long-lived assets for impairment when management makes the
decision to relocate or close a warehouse or when events or changes in circumstances occur that may
indicate the carrying amount of the asset group may not be fully recoverable. The Company evaluates
whether the carrying value of the asset group is recoverable by comparing the estimated future
undiscounted cash flows generated from the use of the asset group and its eventual disposition with
the asset group’s reported net carrying value. The Company recorded a pre-tax, non-cash charge of
$3,893 in fiscal 2005, reflecting its estimate of impairment relating to real property. The charge reflects
the difference between the carrying value and fair value, which was based on estimated market
valuations for those asset groups whose carrying value is not currently anticipated to be recoverable
through future cash flows.
52