Costco 2007 Annual Report Download - page 30
Download and view the complete annual report
Please find page 30 of the 2007 Costco annual report below. You can navigate through the pages in the report by either clicking on the pages listed below, or by using the keyword search tool below to find specific information within the annual report.-
 1
1 -
2
-
3
-
4
-
5
-
6
-
7
-
8
-
9
-
10
-
11
-
12
-
13
-
14
-
15
-
16
-
17
-
18
-
19
-
 20
20 -
 21
21 -
 22
22 -
 23
23 -
 24
24 -
 25
25 -
 26
26 -
 27
27 -
 28
28 -
 29
29 -
 30
30 -
 31
31 -
 32
32 -
 33
33 -
 34
34 -
 35
35 -
 36
36 -
 37
37 -
 38
38 -
 39
39 -
 40
40 -
41
-
42
-
43
-
44
-
45
-
46
-
47
-
48
-
49
-
50
-
51
-
52
-
53
-
54
-
55
-
56
-
57
-
58
-
59
-
60
-
61
-
62
-
63
-
64
-
65
-
66
-
67
-
68
-
69
-
70
-
71
-
72
-
73
-
74
-
75
-
76
-
77
-
78
-
79
-
80
-
81
-
82
-
83
-
84
 |
 |

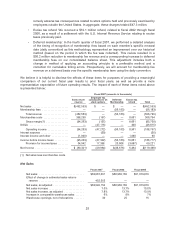
points in gross margin in our merchandise departments and warehouse ancillary businesses was
primarily due to changes in the sales mix, with higher sales penetration of lower margin departments
and slightly lower overall gross margins in our hardlines and softlines categories. These decreases
were partially offset by a three basis point improvement related to valuing inventories following the
last-in-first-out (LIFO) method.
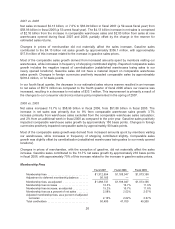
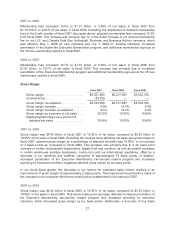
Selling, General and Administrative Expenses
Fiscal 2007 Fiscal 2006 Fiscal 2005
Selling, general and administrative
expense (SG&A) .................... $6,273,096 $5,732,141 $5,061,339
Unusual items ........................ (46,815) — —
SG&A, as adjusted .................... $6,226,281 $5,732,141 $5,061,339
SG&A a percent of net sales ............ 9.94% 9.72% 9.76%
Adjusted SG&A as percent of adjusted net
sales ............................. 9.80% 9.72% 9.76%
2007 vs. 2006
SG&A expenses were $6.27 billion, or 9.94% of net sales in fiscal 2007, compared to $5.73 billion, or
9.72% of net sales in fiscal 2006. Excluding the unusual items affecting net sales and SG&A expenses
in fiscal 2007, adjusted SG&A as a percentage of adjusted net sales was 9.80%, an increase of eight
basis points. Of this increase, 3 basis points were primarily due to an increase in stock-based
compensation, and a net 5 basis points were due to an increase in warehouse payroll and benefits
costs. The payroll increase was largely attributed to hourly rate increases that went into effect in March
2007 and a lower overall comparable warehouse sales increase.
2006 vs. 2005
SG&A expenses were $5.73 billion, or 9.72% of net sales in fiscal 2006, compared to $5.06 billion, or
9.76% of net sales in fiscal 2005. Improved warehouse and central operating costs positively impacted
SG&A by approximately nine basis points, primarily due to increased expense leverage of warehouse
payroll, which was positively impacted by strong comparable warehouse sales and a lower rate of
increase in workers’ compensation costs. This improvement was partially offset by an increase in
stock-based compensation cost of approximately five basis points in fiscal 2006.
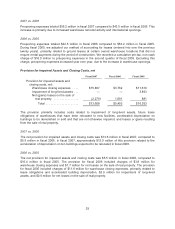
Preopening Expenses
Fiscal 2007 Fiscal 2006 Fiscal 2005
Preopening expenses ......................... $55,163 $42,504 $53,230
Warehouse openings .......................... 30 28 21
Relocations .................................. — (3) (5)
Warehouse openings, net of relocations .......... 30 25 16
Preopening expenses include costs incurred for startup operations related to new warehouses,
warehouse remodel projects and the expansion of ancillary operations at existing warehouses.
Preopening expenses per warehouse opening can vary due to the timing of the opening relative to our
fiscal year end, whether the warehouse is owned or leased, whether the opening is in an existing, new
or international market and the number and magnitude of warehouse remodel projects.
28