Costco 2007 Annual Report Download - page 3
Download and view the complete annual report
Please find page 3 of the 2007 Costco annual report below. You can navigate through the pages in the report by either clicking on the pages listed below, or by using the keyword search tool below to find specific information within the annual report.-
 1
1 -
 2
2 -
 3
3 -
 4
4 -
 5
5 -
 6
6 -
 7
7 -
 8
8 -
 9
9 -
 10
10 -
 11
11 -
 12
12 -
 13
13 -
 14
14 -
15
-
16
-
17
-
18
-
19
-
20
-
21
-
22
-
23
-
24
-
25
-
26
-
27
-
28
-
29
-
30
-
31
-
32
-
33
-
34
-
35
-
36
-
37
-
38
-
39
-
40
-
41
-
42
-
43
-
44
-
45
-
46
-
47
-
48
-
49
-
50
-
51
-
52
-
53
-
54
-
55
-
56
-
57
-
58
-
59
-
60
-
61
-
62
-
63
-
64
-
65
-
66
-
67
-
68
-
69
-
70
-
71
-
72
-
73
-
74
-
75
-
76
-
77
-
78
-
79
-
80
-
81
-
82
-
83
-
84
 |
 |

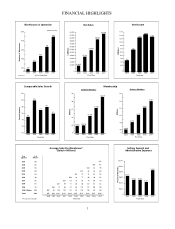
Warehouses in Operation
At Fiscal Year End
Number of Warehouses
500
475
2003 2005
450
425
397
(499 at 12/31/07)
400
0
2006
417
433
2007
458
2004
Excludes Mexico
488
Net Sales
Fiscal Year
$ Millions
2003 2005 2006
42,000
46,000
44,000
48,000
50,000
52,000
54,000
56,000
58,000
60,000
2004
41,695
47,149
51,879
2007
58,963
0
62,000
64,000 63,088
Net Income
Fiscal Year
$ Millions
2003 2005
1,150
0
1,050
1,100
900
950
1,000
650
850
700
750
800
721
2006
882
1,063
2007
1,103
2004
1,103
1,083
Comparable Sales Growth
Fis
c
al Year
Percent Increase
2003 2005 2006
10%
0%
2%
4%
6%
8%
10%
12%
7%
2007
8%
2004
5%
6%
Average Sales Per Warehouse*
(Sales In Millions)
Fiscal Year
*First year sales annualized.
2003
119
105
72
85
62
$67
$105
2002
114
97
63
77
$58
$103
2001
109
86
$57
65
$101
2000
105
77
$57
$101
1999
95
$65
$94
1998
$87
$87
488Totals
2761998 & Before
1999 15
2000 21
2001 32
2002 29
2003 24
2004 20
2005 16
2006 25
302007
Whses*Opened
# ofYear
2004
129
120
84
98
77
79
$72
$115
2005
135
127
94
107
88
91
81
$120
$63
2006
143
136
105
117
98
101
99
$127
81
$92
2007
148
145
121
107
114
107
109
95
$130
101
$76
Selling, General and
Administrative Expenses
Fiscal Year
Percent of Net Sales
2003 2004
0
10.10%
10.00%
9.90%
9.80%
9.70%
2005
9.83%
2006
9.76% 9.76%
2007
9.94%
9.60%
9.72%
Fiscal Year
2003 2005
4.636
4.6
4.8
5.0
5.2
5.4
5.6
0
2006
4.810
5.050
2007
5.214
2004
Business Members
Fiscal Year
Mi
ll
ions
Millions
2003 2005
14.984
0
17
19
16
18
2006
15.018
16.233
2007
18.619
2004
Gold Star Members
Membership
15
17.338
5.401
FINANCIAL HIGHLIGHTS
1