Costco 2007 Annual Report Download - page 51
Download and view the complete annual report
Please find page 51 of the 2007 Costco annual report below. You can navigate through the pages in the report by either clicking on the pages listed below, or by using the keyword search tool below to find specific information within the annual report.-
 1
1 -
2
-
3
-
4
-
5
-
6
-
7
-
8
-
9
-
10
-
11
-
12
-
13
-
14
-
15
-
16
-
17
-
18
-
19
-
20
-
21
-
22
-
23
-
24
-
25
-
26
-
27
-
28
-
29
-
30
-
31
-
32
-
33
-
34
-
35
-
36
-
37
-
38
-
39
-
40
-
 41
41 -
 42
42 -
 43
43 -
 44
44 -
 45
45 -
 46
46 -
 47
47 -
 48
48 -
 49
49 -
 50
50 -
 51
51 -
 52
52 -
 53
53 -
 54
54 -
 55
55 -
 56
56 -
 57
57 -
 58
58 -
 59
59 -
 60
60 -
 61
61 -
62
-
63
-
64
-
65
-
66
-
67
-
68
-
69
-
70
-
71
-
72
-
73
-
74
-
75
-
76
-
77
-
78
-
79
-
80
-
81
-
82
-
83
-
84
 |
 |

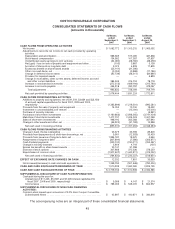
COSTCO WHOLESALE CORPORATION
CONSOLIDATED STATEMENTS OF CASH FLOWS
(amounts in thousands)
52 Weeks
ended
September 2,
2007
53 Weeks
ended
September 3,
2006
52 Weeks
ended
August 28,
2005
CASH FLOWS FROM OPERATING ACTIVITIES
Net income ..................................................... $1,082,772 $ 1,103,215 $ 1,063,092
Adjustments to reconcile net income to net cash provided by operating
activities:
Depreciation and amortization .................................... 566,385 515,285 481,838
Stock-based compensation ...................................... 134,582 107,397 67,937
Undistributed equity earnings in joint ventures ...................... (34,080) (28,180) (26,459)
Net (gain) / loss on sale of property and equipment and other .......... (105) 5,867 5,139
Accretion of discount on long-term debt ............................ 3,074 4,828 11,855
Excess tax benefit on share based awards ......................... (25,141) (31,296) —
Other non-cash items, net ....................................... (5,055) (5,888) (11,186)
Change in deferred income taxes ................................. (92,739) (38,311) (64,690)
Provision for impaired assets ..................................... — — 3,893
Change in receivables, other current assets, deferred income, accrued
and other current liabilities ..................................... 284,306 414,704 78,118
Increase in merchandise inventories .............................. (272,513) (499,194) (315,793)
Increase in accounts payable .................................... 434,918 282,797 479,067
Total adjustments ............................................ 993,632 728,009 709,719
Net cash provided by operating activities ........................... 2,076,404 1,831,224 1,772,811
CASH FLOWS FROM INVESTING ACTIVITIES
Additions to property and equipment, net of $41,519, $3,934 and $(3,150)
of accrued capital expenditures for fiscal 2007, 2006 and 2005,
respectively ................................................... (1,385,699) (1,216,501) (992,281)
Proceeds from the sale of property and equipment ..................... 14,054 15,740 19,432
Investment in unconsolidated joint venture ........................... — (15,000) (15,000)
Purchase of minority interests ...................................... — — (3,961)
Purchases of short-term investments ................................ (1,160,663) (2,598,355) (3,741,429)
Maturities of short-term investments ................................. 1,417,731 2,424,503 2,401,248
Sales of short-term investments .................................... 496,192 263,288 267,640
Change in other assets and other, net ............................... (36,925) (31,169) 15,988
Net cash used in investing activities ............................... (655,310) (1,157,494) (2,048,363)
CASH FLOWS FROM FINANCING ACTIVITIES
Change in bank checks outstanding ................................. 23,375 33,559 85,829
Proceeds from/(repayments of) short-term borrowings, net .............. 9,961 (12,929) 33,433
Proceeds from issuance of long-term debt, net ........................ 1,994,187 18,375 5,660
Repayments of long-term debt ..................................... (307,894) (7,586) (303,877)
Cash dividend payments .......................................... (245,742) (230,211) (204,567)
Change in minority interests ....................................... 5,959 4,744 (130)
Excess tax benefit on share based awards ........................... 25,141 31,296 —
Exercise of stock options .......................................... 307,988 372,336 278,253
Repurchases of common stock ..................................... (1,977,607) (1,442,811) (413,252)
Net cash used in financing activities ............................... (164,632) (1,233,227) (518,651)
EFFECT OF EXCHANGE RATE CHANGES ON CASH .................. 12,332 7,851 33,653
Net increase/(decrease) in cash and cash equivalents .................. 1,268,794 (551,646) (760,550)
CASH AND CASH EQUIVALENTS BEGINNING OF YEAR .............. 1,510,939 2,062,585 2,823,135
CASH AND CASH EQUIVALENTS END OF YEAR ..................... $2,779,733 $ 1,510,939 $ 2,062,585
SUPPLEMENTAL DISCLOSURE OF CASH FLOW INFORMATION:
Cash paid during the year for:
Interest (net of $11,423, $12,681 and $7,226 interest capitalized for
fiscal 2007, 2006 and 2005, respectively) ........................ $ 9,369 $ 4,147 $ 21,374
Income taxes .................................................. $ 786,283 $ 546,205 $ 804,957
SUPPLEMENTAL DISCLOSURE OF NON-CASH FINANCING
ACTIVITIES:
Common stock issued upon conversion of 3.5% Zero Coupon Convertible
Subordinated Notes ............................................ $ 42,697 $ 190,871 $ 280,816
The accompanying notes are an integral part of these consolidated financial statements.
49