Costco 2007 Annual Report Download - page 68
Download and view the complete annual report
Please find page 68 of the 2007 Costco annual report below. You can navigate through the pages in the report by either clicking on the pages listed below, or by using the keyword search tool below to find specific information within the annual report.-
 1
1 -
2
-
3
-
4
-
5
-
6
-
7
-
8
-
9
-
10
-
11
-
12
-
13
-
14
-
15
-
16
-
17
-
18
-
19
-
20
-
21
-
22
-
23
-
24
-
25
-
26
-
27
-
28
-
29
-
30
-
31
-
32
-
33
-
34
-
35
-
36
-
37
-
38
-
39
-
40
-
41
-
42
-
43
-
44
-
45
-
46
-
47
-
48
-
49
-
50
-
51
-
52
-
53
-
54
-
55
-
56
-
57
-
 58
58 -
 59
59 -
 60
60 -
 61
61 -
 62
62 -
 63
63 -
 64
64 -
 65
65 -
 66
66 -
 67
67 -
 68
68 -
 69
69 -
 70
70 -
 71
71 -
 72
72 -
 73
73 -
 74
74 -
 75
75 -
 76
76 -
 77
77 -
 78
78 -
79
-
80
-
81
-
82
-
83
-
84
 |
 |

In conjunction with the adoption of SFAS 123 at the beginning of fiscal 2003, the Company changed its
method of attributing the value of stock-based compensation expense from the graded-vesting method
to the straight-line method. Under the graded-vesting method, an award is accounted for as multiple
awards, based on the number of vesting tranches, each tranche with a different requisite service
period. The effect of graded-vesting attribution is to recognize more compensation expense in the early
years of the overall vesting period. Compensation expense for all stock-based awards granted prior to
fiscal 2003 will continue to be recognized using the graded-vesting method, while compensation
expense for all stock-based awards granted subsequent to fiscal 2002 is being recognized using the
straight-line method. SFAS 123R requires the estimation of the number of stock-based awards that will
ultimately not complete their vesting requirements (forfeitures), and requires that the compensation
expense recognized equals or exceeds the number of stock-based awards vested. While options and
RSUs generally vest over five years with an equal amount vesting on each anniversary of the grant
date, the Company’s plans allow for daily vesting of the pro-rata number of stock-based awards that
would vest on the next anniversary of the grant date in the event of retirement or voluntary termination.
As such, the Company does not reduce stock-based compensation for an estimate of forfeitures
because this would result in less compensation expense recognized than the number of stock-based
awards vested. The impact of actual forfeitures arising in the event of involuntary termination is
recognized as actual forfeitures occur.
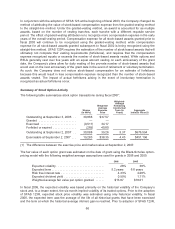
Summary of Stock Option Activity
The following table summarizes stock option transactions during fiscal 2007:
Shares
(in 000’s)
Weighted-
Average
Exercise
Price
Weighted-
Average
Remaining
Contractual
Term (in
Years)
Aggregate
Intrinsic Value(1)
Outstanding at September 3, 2006 . . 39,868 $37.57
Granted ........................ — —
Exercised ....................... (9,511) 34.17
Forfeited or expired ............... (269) 40.80
Outstanding at September 2, 2007 . . 30,088 39.26 5.37 $676,594
Exercisable at September 2, 2007 . . . 19,283 $38.35 4.43 $451,196
(1) The difference between the exercise price and market value at September 2, 2007.
The fair value of each option grant was estimated on the date of grant using the Black-Scholes option-
pricing model with the following weighted average assumptions used for grants in 2006 and 2005:
2006 2005
Expected volatility ............................... 28% 38%
Expected term .................................. 5.2years 6.6 years
Risk free interest rate ............................ 4.33% 4.28%
Expected dividend yield .......................... 0.99% 1.11%
Weighted-average fair value per option granted ...... $13.87 $18.01
In fiscal 2006, the expected volatility was based primarily on the historical volatility of the Company’s
stock and, to a lesser extent, the six-month implied volatility of its traded options. Prior to the adoption
of SFAS 123R, expected stock price volatility was estimated using only historical volatility. In fiscal
2006, the expected term was the average of the life of all historical grants that have been exercised
and the term at which the historical average intrinsic gain is reached. Prior to adoption of SFAS 123R,
66