Costco 2007 Annual Report Download - page 73
Download and view the complete annual report
Please find page 73 of the 2007 Costco annual report below. You can navigate through the pages in the report by either clicking on the pages listed below, or by using the keyword search tool below to find specific information within the annual report.-
 1
1 -
2
-
3
-
4
-
5
-
6
-
7
-
8
-
9
-
10
-
11
-
12
-
13
-
14
-
15
-
16
-
17
-
18
-
19
-
20
-
21
-
22
-
23
-
24
-
25
-
26
-
27
-
28
-
29
-
30
-
31
-
32
-
33
-
34
-
35
-
36
-
37
-
38
-
39
-
40
-
41
-
42
-
43
-
44
-
45
-
46
-
47
-
48
-
49
-
50
-
51
-
52
-
53
-
54
-
55
-
56
-
57
-
58
-
59
-
60
-
61
-
62
-
 63
63 -
 64
64 -
 65
65 -
 66
66 -
 67
67 -
 68
68 -
 69
69 -
 70
70 -
 71
71 -
 72
72 -
 73
73 -
 74
74 -
 75
75 -
 76
76 -
 77
77 -
 78
78 -
 79
79 -
 80
80 -
 81
81 -
 82
82 -
 83
83 -
84
 |
 |

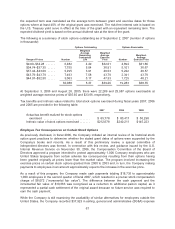
The deferred tax accounts at September 2, 2007 and September 3, 2006 include current deferred
income tax assets of $214,723 and $162,534, respectively, included in deferred income taxes and
other current assets; non-current deferred income tax assets of $10,063 and $12,109, respectively,
included in other assets; and non-current deferred income tax liabilities of $122,089 and $159,781,
respectively, included in deferred income taxes and other liabilities.
The effective income tax rate on earnings was 36.68% in fiscal 2007, 37.01% in fiscal 2006 and
31.37% in fiscal 2005. The lower effective income tax rate in fiscal 2005 is primarily attributable to a
$54,155 income tax benefit resulting from the settlement of a transfer pricing dispute between the
United States and Canada (covering the years 1996-2003) and a net tax benefit on unremitted foreign
earnings of $20,592. The Company recognized a tax benefit of $30,602, resulting from excess foreign
tax credits on unremitted foreign earnings, and recognized a tax expense of $10,010, resulting from tax
expense on translation gains accumulated to the date that the Company determined that certain
unremitted foreign earnings were no longer permanently reinvested. The net benefit of $20,592 related
to that portion of unremitted foreign earnings that the Company planned to repatriate in the foreseeable
future. Excluding these benefits the effective income tax rate on earnings in fiscal 2005 was 36.2%.
During fiscal 2007 and 2006, the Company distributed $119,588 and $427,296, respectively, from its
Canadian operations.
The Company has not provided for U.S. deferred taxes on cumulative undistributed earnings of
non-U.S. affiliates, including its 50% owned investment in the Mexico corporate joint venture,
aggregating $1,046,747 and $907,090 at September 2, 2007 and September 3, 2006, respectively, as
such earnings are deemed permanently reinvested. Because of the availability of U.S. foreign tax
credits and complexity of the computation, it is not practicable to determine the U.S. federal income tax
liability or benefit associated with such earnings if such earnings were not deemed to be permanently
reinvested.
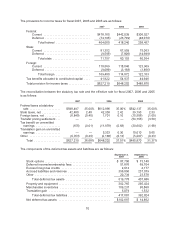
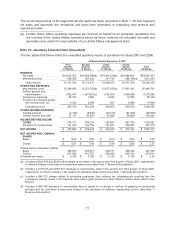
Note 9—Net Income Per Common and Common Equivalent Share
The following data show the amounts used in computing net income per share and the effect on
income and the weighted average number of shares of dilutive potential common stock.
Fiscal Year Ended
September 2,
2007
September 3,
2006
August 28,
2005
Net income available to common stockholders used in
basic net income per share ..................... $1,082,772 $1,103,215 $1,063,092
Interest on convertible notes, net of tax ............. 1,577 3,040 7,672
Net income available to common stockholders after
assumed conversions of dilutive securities ......... $1,084,349 $1,106,255 $1,070,764
Weighted average number of common shares used in
basic net income per share (000’s) ............... 447,659 469,718 473,945
Stock options and restricted stock units (000’s) ....... 7,621 5,944 6,000
Conversion of convertible bonds (000’s) ............. 2,361 4,679 12,090
Weighted number of common shares and dilutive
potential of common stock used in diluted net income
per share (000’s) per share ..................... 457,641 480,341 492,035
The diluted share base calculation for fiscal years ended September 2, 2007, September 3, 2006 and
August 28, 2005, excluded 692,000, 11,142,000 and 12,575,000 stock options outstanding,
respectively. These equity instruments are excluded due to their anti-dilutive effect. All outstanding
RSUs are dilutive for all fiscal years presented and thus are included in the table above.
71