Costco 2007 Annual Report Download - page 33
Download and view the complete annual report
Please find page 33 of the 2007 Costco annual report below. You can navigate through the pages in the report by either clicking on the pages listed below, or by using the keyword search tool below to find specific information within the annual report.-
 1
1 -
2
-
3
-
4
-
5
-
6
-
7
-
8
-
9
-
10
-
11
-
12
-
13
-
14
-
15
-
16
-
17
-
18
-
19
-
20
-
21
-
22
-
 23
23 -
 24
24 -
 25
25 -
 26
26 -
 27
27 -
 28
28 -
 29
29 -
 30
30 -
 31
31 -
 32
32 -
 33
33 -
 34
34 -
 35
35 -
 36
36 -
 37
37 -
 38
38 -
 39
39 -
 40
40 -
 41
41 -
 42
42 -
 43
43 -
44
-
45
-
46
-
47
-
48
-
49
-
50
-
51
-
52
-
53
-
54
-
55
-
56
-
57
-
58
-
59
-
60
-
61
-
62
-
63
-
64
-
65
-
66
-
67
-
68
-
69
-
70
-
71
-
72
-
73
-
74
-
75
-
76
-
77
-
78
-
79
-
80
-
81
-
82
-
83
-
84
 |
 |

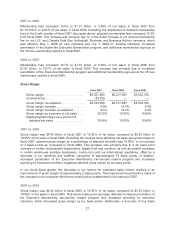
2007 vs. 2006
Interest income and other totaled $165.5 million in fiscal 2007, compared to $138.4 million in fiscal
2006. This increase is largely due to the increase in our cash and cash equivalents and short-term
investments resulting from increased earnings from operations and the proceeds of the issuance of the
2007 Senior Notes, as well as an increase in the earnings of affiliates, primarily our investment in
Costco Mexico (a 50%-owned joint venture).
2006 vs. 2005
Interest income and other totaled $138.4 million in fiscal 2006, compared to $109.1 million in fiscal
2005. This increase primarily reflects increased interest income resulting from higher interest rates
earned, as well as an extra week in fiscal 2006 as compared to fiscal 2005.
Provision for Income Taxes
Fiscal 2007 Fiscal 2006 Fiscal 2005
Income tax expense ....................... $627,219 $648,202 $485,870
Effective tax rate .......................... 36.68% 37.01% 31.37%
The effective income tax rate on earnings in fiscal 2007, 2006 and 2005 was 36.68%, 37.01% and
31.37%, respectively. The lower rate in fiscal 2005 was primarily attributable to a non-recurring
$54.2 million income tax benefit, primarily from the settlement of a transfer pricing dispute between the
United States and Canada (covering the years 1996-2003) and a net tax benefit on excess foreign tax
credits on unremitted foreign earnings subject to repatriation of $20.6 million. Excluding these benefits
the effective income tax rate on earnings in fiscal 2005 would have been 36.20%.
Net Income
Fiscal 2007 Fiscal 2006 Fiscal 2005
Net income .......................... $1,082,772 $1,103,215 $1,063,092
Unusual items (net of tax) .............. 119,496 — —
Net income, as adjusted ............... $1,202,268 $1,103,215 $1,063,092
Diluted earnings per share ............. $ 2.37 $ 2.30 $ 2.18
Shares used to calculate diluted net
income per common share ........... 457,641 480,341 492,035
Diluted earnings per share increase ...... 3% 6% 18%
2007 vs. 2006
Net income for fiscal 2007 was $1.08 billion, or $2.37 per diluted share, compared to $1.10 billion, or
$2.30 per diluted share, during fiscal 2006. During fiscal 2007, we repurchased 36.4 million shares of
common stock, favorably impacting earnings per diluted share by approximately $0.03. The unusual
items previously discussed totaled $119.5 million, net of tax, or $0.26 per diluted share in fiscal 2007.
Exclusive of these items, earnings for fiscal 2007 were $2.63 per diluted share, a 14% increase over
the prior year.
2006 vs. 2005
Net income for fiscal 2006 increased 3.8%, to $1.10 billion or $2.30 per diluted share, from $1.06 billion
or $2.18 per diluted share, during fiscal 2005. During fiscal 2006, we repurchased 28.4 million shares
of common stock, favorably impacting earnings per diluted share by approximately $0.02. The fiscal
2005 results included several non-recurring items that in the aggregate positively impacted reported
31