Costco 2007 Annual Report Download - page 67
Download and view the complete annual report
Please find page 67 of the 2007 Costco annual report below. You can navigate through the pages in the report by either clicking on the pages listed below, or by using the keyword search tool below to find specific information within the annual report.-
 1
1 -
2
-
3
-
4
-
5
-
6
-
7
-
8
-
9
-
10
-
11
-
12
-
13
-
14
-
15
-
16
-
17
-
18
-
19
-
20
-
21
-
22
-
23
-
24
-
25
-
26
-
27
-
28
-
29
-
30
-
31
-
32
-
33
-
34
-
35
-
36
-
37
-
38
-
39
-
40
-
41
-
42
-
43
-
44
-
45
-
46
-
47
-
48
-
49
-
50
-
51
-
52
-
53
-
54
-
55
-
56
-
 57
57 -
 58
58 -
 59
59 -
 60
60 -
 61
61 -
 62
62 -
 63
63 -
 64
64 -
 65
65 -
 66
66 -
 67
67 -
 68
68 -
 69
69 -
 70
70 -
 71
71 -
 72
72 -
 73
73 -
 74
74 -
 75
75 -
 76
76 -
 77
77 -
78
-
79
-
80
-
81
-
82
-
83
-
84
 |
 |

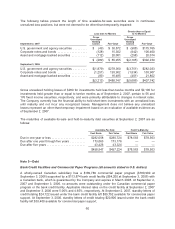
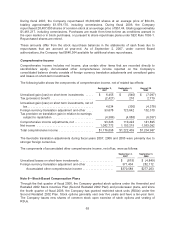
During fiscal 2007, the Company repurchased 36,390,000 shares at an average price of $54.39,
totaling approximately $1,979,170, including commissions. During fiscal 2006, the Company
repurchased 28,407,000 shares of common stock at an average price of $51.44, totaling approximately
$1,461,217, including commissions. Purchases are made from time-to-time as conditions warrant in
the open market or in block purchases, or pursuant to share repurchase plans under SEC Rule 10b5-1.
Repurchased shares are retired.
These amounts differ from the stock repurchase balances in the statements of cash flows due to
repurchases that are accrued at year-end. As of September 2, 2007, under current Board
authorizations, the Company had $646,364 available for additional share repurchases.
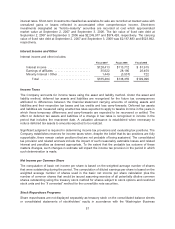
Comprehensive Income
Comprehensive income includes net income, plus certain other items that are recorded directly to
stockholders’ equity. Accumulated other comprehensive income reported on the Company’s
consolidated balance sheets consists of foreign currency translation adjustments and unrealized gains
and losses on short-term investments.
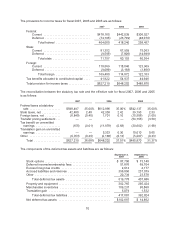
The following table shows the components of comprehensive income, net of related tax effects:
September 2,
2007
September 3,
2006
August 28,
2005
Unrealized gain (loss) on short-term investments ..... $ 6,455 $ (540) $ (7,097)
Tax (provision) benefit ........................... (2,421) 210 2,719
Unrealized gain (loss) on short term investments, net of
tax.......................................... 4,034 (330) (4,378)
Foreign currency translation adjustment and other .... 93,678 123,642 152,310
Tax provision on translation gain in relation to earnings
subject to repatriation .......................... (4,386) (4,088) (6,037)
Comprehensive income adjustments, net ............ 93,326 119,224 141,895
Net income .................................... 1,082,772 1,103,215 1,063,092
Total comprehensive income ...................... $1,176,098 $1,222,439 $1,204,987
The favorable translation adjustments during fiscal years 2007, 2006 and 2005 were primarily due to
stronger foreign currencies.
The components of accumulated other comprehensive income, net of tax, were as follows:
September 2,
2007
September 3,
2006
Unrealized losses on short-term investments ...................... $ (815) $ (4,849)
Foreign currency translation adjustment and other ................. 371,404 282,112
Accumulated other comprehensive income .................... $370,589 $277,263
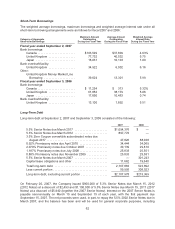
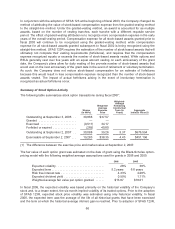
Note 6—Stock-Based Compensation Plans
Through the first quarter of fiscal 2006, the Company granted stock options under the Amended and
Restated 2002 Stock Incentive Plan (Second Restated 2002 Plan) and predecessor plans, and since
the fourth quarter of fiscal 2006, the Company has granted restricted stock units (RSUs) under the
Second Restated 2002 Plan. Stock options generally vest over five years and have a ten-year term.
The Company issues new shares of common stock upon exercise of stock options and vesting of
RSUs.
65