Costco 2007 Annual Report Download - page 34
Download and view the complete annual report
Please find page 34 of the 2007 Costco annual report below. You can navigate through the pages in the report by either clicking on the pages listed below, or by using the keyword search tool below to find specific information within the annual report.-
 1
1 -
2
-
3
-
4
-
5
-
6
-
7
-
8
-
9
-
10
-
11
-
12
-
13
-
14
-
15
-
16
-
17
-
18
-
19
-
20
-
21
-
22
-
23
-
 24
24 -
 25
25 -
 26
26 -
 27
27 -
 28
28 -
 29
29 -
 30
30 -
 31
31 -
 32
32 -
 33
33 -
 34
34 -
 35
35 -
 36
36 -
 37
37 -
 38
38 -
 39
39 -
 40
40 -
 41
41 -
 42
42 -
 43
43 -
 44
44 -
45
-
46
-
47
-
48
-
49
-
50
-
51
-
52
-
53
-
54
-
55
-
56
-
57
-
58
-
59
-
60
-
61
-
62
-
63
-
64
-
65
-
66
-
67
-
68
-
69
-
70
-
71
-
72
-
73
-
74
-
75
-
76
-
77
-
78
-
79
-
80
-
81
-
82
-
83
-
84
 |
 |
earnings for all of fiscal 2005 by approximately $0.14 per share: a $54.2 million (approximately $0.11
per diluted share) income tax benefit resulting primarily from the settlement of a transfer pricing dispute
between the United States and Canada; a cumulative pre-tax, non-cash charge to preopening
expenses of $16.0 million (approximately $0.02 per diluted share) related to a correction to our method
of accounting for ground leases; and a net tax benefit with respect to excess foreign tax credits on
unremitted foreign earnings recorded in the fourth quarter of $20.6 million (approximately $0.04 per
diluted share). Exclusive of these items, fiscal 2005 earnings were $2.04 per diluted share. Fiscal
2006’s earnings per diluted share represents an increase of 13% over that figure.
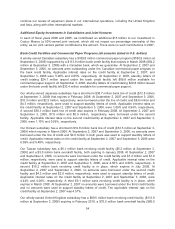
Liquidity and Capital Resources
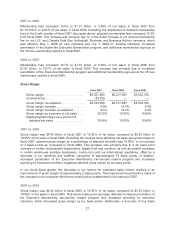
The following table itemizes our most liquid assets (dollars in thousands):
September 2,
2007
September 3,
2006
Cash and cash equivalents ........................... $2,779,733 $1,510,939
Short-term investments .............................. 575,787 1,322,181
Total .......................................... $3,355,520 $2,833,120
Our primary sources of liquidity are cash flows generated from warehouse operations and our existing
cash and cash equivalents and short-term investments balances, which were $3.36 billion and $2.83
billion at September 2, 2007 and September 3, 2006, respectively. Of these balances, approximately
$655.2 million and $593.6 million at September 2, 2007 and September 3, 2006, respectively,
represented debit and credit card receivables, primarily related to weekend sales immediately prior to
the year-end close. The increase in our most liquid assets of $522.4 million to $3.36 billion at
September 2, 2007 was due primarily to the issuance of the 2007 Senior Notes and the cash provided
by our operating activities, offset by expenditures for the repurchase of our common stock and the
acquisition of property and equipment related to warehouse expansion.
Net cash provided by operating activities totaled $2.08 billion in fiscal 2007 compared to $1.83 billion in
fiscal 2006, an increase of $245.2 million. This increase was primarily attributable to an increase in
cash flow due to a decrease in our investment in net merchandise inventories (merchandise inventory
less accounts payable) of $378.8 million, offset by a decrease in cash flow from operating assets and
liabilities of $130.4 million.
Net cash used in investing activities totaled $655.3 million in fiscal 2007 compared to $1.16 billion in
fiscal 2006, respectively, a decrease of approximately $502.2 million. The decrease in cash used in
investing activities relates primarily to an increase of $169.2 million in additions to property and
equipment related to warehouse expansion and remodel projects, offset by an increase in cash
provided by the net reductions in short-term investments of $663.8 million.
Net cash used in financing activities totaled $164.6 million in fiscal 2007 compared to $1.23 billion in
fiscal 2006. The $1.1 billion decrease in net cash used in financing activities was primarily due to the
issuance of the 2007 Senior Notes in February 2007, which provided approximately $1.99 billion in
proceeds. This was partially offset by the repurchase of common stock in fiscal 2007, which used
$1.98 billion of cash, compared to $1.44 billion in fiscal 2006, an increase of approximately $534.8
million and the repayment of long-term debt of $307.9 million related primarily to the 2002 Senior Notes
retired in March 2007.
32