Comcast 2010 Annual Report Download - page 90
Download and view the complete annual report
Please find page 90 of the 2010 Comcast annual report below. You can navigate through the pages in the report by either clicking on the pages listed below, or by using the keyword search tool below to find specific information within the annual report.-
 1
1 -
2
-
3
-
4
-
5
-
6
-
7
-
8
-
9
-
10
-
11
-
12
-
13
-
14
-
15
-
16
-
17
-
18
-
19
-
20
-
21
-
22
-
23
-
24
-
25
-
26
-
27
-
28
-
29
-
30
-
31
-
32
-
33
-
34
-
35
-
36
-
37
-
38
-
39
-
40
-
41
-
42
-
43
-
44
-
45
-
46
-
47
-
48
-
49
-
50
-
51
-
52
-
53
-
54
-
55
-
56
-
57
-
58
-
59
-
60
-
61
-
62
-
63
-
64
-
65
-
66
-
67
-
68
-
69
-
70
-
71
-
72
-
73
-
74
-
75
-
76
-
77
-
78
-
79
-
 80
80 -
 81
81 -
 82
82 -
 83
83 -
 84
84 -
 85
85 -
 86
86 -
 87
87 -
 88
88 -
 89
89 -
 90
90 -
 91
91 -
 92
92 -
 93
93 -
 94
94 -
 95
95 -
 96
96 -
 97
97 -
 98
98 -
 99
99 -
 100
100 -
101
-
102
-
103
-
104
-
105
-
106
-
107
-
108
-
109
-
110
-
111
-
112
-
113
-
114
-
115
-
116
-
117
-
118
-
119
-
120
-
121
-
122
-
123
-
124
-
125
-
126
-
127
-
128
-
129
-
130
-
131
-
132
-
133
-
134
-
135
-
136
-
137
-
138
-
139
-
140
-
141
-
142
-
143
-
144
-
145
-
146
-
147
-
148
-
149
-
150
-
151
-
152
-
153
-
154
-
155
-
156
-
157
-
158
-
159
-
160
-
161
-
162
-
163
-
164
-
165
-
166
-
167
-
168
-
169
-
170
-
171
-
172
-
173
-
174
-
175
-
176
-
177
-
178
-
179
-
180
-
181
-
182
-
183
-
184
-
185
-
186
-
187
-
188
-
189
-
190
-
191
-
192
-
193
-
194
-
195
-
196
-
197
-
198
-
199
-
200
-
201
-
202
-
203
-
204
-
205
-
206
-
207
-
208
-
209
-
210
-
211
-
212
-
213
-
214
-
215
-
216
-
217
-
218
-
219
-
220
-
221
-
222
-
223
-
224
-
225
-
226
-
227
-
228
-
229
-
230
-
231
-
232
-
233
-
234
-
235
-
236
-
237
-
238
-
239
-
240
-
241
-
242
-
243
-
244
-
245
-
246
-
247
-
248
-
249
-
250
-
251
-
252
-
253
-
254
-
255
-
256
-
257
-
258
-
259
-
260
-
261
-
262
-
263
-
264
-
265
-
266
-
267
-
268
-
269
-
270
-
271
-
272
-
273
-
274
-
275
-
276
-
277
-
278
-
279
-
280
-
281
-
282
-
283
-
284
-
285
-
286
-
287
-
288
-
289
-
290
-
291
-
292
-
293
-
294
-
295
-
296
-
297
-
298
-
299
-
300
-
301
-
302
-
303
-
304
-
305
-
306
-
307
-
308
-
309
-
310
-
311
-
312
-
313
-
314
-
315
-
316
-
317
-
318
-
319
-
320
-
321
-
322
-
323
-
324
-
325
-
326
-
327
-
328
-
329
-
330
-
331
-
332
-
333
-
334
-
335
-
336
-
337
-
338
-
339
-
340
-
341
-
342
-
343
-
344
-
345
-
346
-
347
-
348
-
349
-
350
-
351
 |
 |

Table of Contents
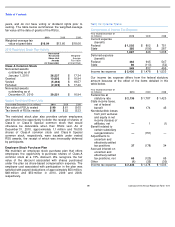
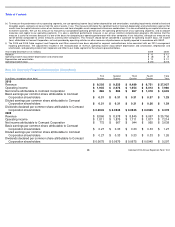
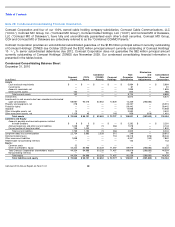
Components of Net Deferred Tax Liability
Changes in net deferred income tax liabilities in 2010 that
were not recorded as deferred income tax expense are
related to decreases of approximately $37 million associated
with items included in other comprehensive income (loss).
Our net deferred tax liability includes approximately $23
billion related to franchise rights that will remain unchanged
unless we recognize an impairment or dispose of a franchise.
Net deferred tax assets included in current assets are
primarily related to our current investments and current
liabilities. As of December 31, 2010, we had federal net
operating loss carryforwards of $173 million and various state
net operating loss carryforwards that expire in periods
through 2030. The determination of the state net operating
loss carryforwards is dependent on our subsidiaries’ taxable
income or loss, apportionment percentages, and state laws
that can change from year to year and impact the amount of
such carryforwards. We recognize a valuation allowance if
we determine it is more likely than not that some portion, or
all, of a deferred tax asset will not be realized. As of
December 31, 2010 and 2009, our valuation allowance was
related primarily to state net operating loss carryforwards. In
2010, 2009 and 2008, income tax benefits (expense)
attributable to share-based compensation of approximately
$(3) million, $14 million and $28 million, respectively, were
allocated to shareholders’ equity.
December 31 (in millions)
2010
2009
Deferred Tax Assets:
Net operating loss
carryforwards
$
343
$
375
Differences between book and
tax basis of long
-
term debt
123
137
Nondeductible accruals and
other
1,301
1,188
Less: Valuation allowance
(207
)
(214
)
1,560
1,486
Deferred Tax Liabilities:
Differences between book and
tax basis of property and
equipment and intangible
assets
28,468
27,870
Differences between book and
tax basis of investments
627
662
Differences between book and
tax basis of indexed debt
securities
537
514
29,632
29,046
Net deferred tax liability
$
28,072
$
27,560
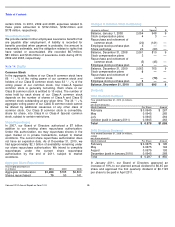
Uncertain Tax Positions
Our uncertain tax positions as of December 31, 2010 totaled
$1.3 billion, excluding the federal benefits on state tax
positions that have been recorded as deferred income taxes.
If we were to recognize the tax benefit for such positions in
the future, approximately $1.0 billion would impact our
effective tax rate, and the remaining amount would increase
our deferred income tax liability.
Reconciliation of Unrecognized Tax Benefits
As of December 31, 2010 and 2009, we had accrued
approximately $604 million and $519 million, respectively, of
interest associated with our uncertain tax positions.
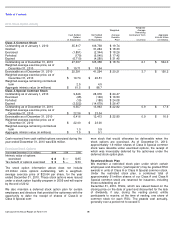
We anticipate that the Internal Revenue Service (“IRS”) and
various states will begin examining our 2009 tax returns in
2011. During 2010, the IRS completed its examination of our
income tax returns for 2007 and 2008 and did not propose
any material adjustments. The IRS completed its examination
of our income tax returns for the years 2000 through 2006
and proposed certain adjustments that relate primarily to
certain financing transactions. We are currently disputing
those proposed adjustments, and we filed petitions with the
United States Tax Court in January 2011. If the adjustments
are sustained, they would not have a material impact on our
effective tax rate. Tax years of our state tax returns currently
under examination vary by state. The majority of the periods
under examination relate to tax years 2000 and forward, with
a select few dating back to 1993.
During 2008, we recognized approximately $411 million of
income tax benefits as a result of the settlement of an
uncertain tax position of an acquired entity. The tax position
related to the deductibility of certain costs incurred in
connection with a business acquisition. The primary impacts
of the settlement were reductions to our deferred income tax
and other long-term liabilities of approximately $542 million, a
reduction to goodwill of approximately $477 million and a
reduction to income tax expense of approximately
$65 million.
(in millions)
2010
2009
2008
Balance, January 1
$
1,185
$
1,450
$
1,921
Additions based on
tax positions
related to the
current year
69
57
55
Additions based on
tax positions
related to prior
years
59
—
30
Reductions for tax
positions of prior
years
(28
)
(257
)
(411
)
Reductions due to
expiration of
statute of
limitations
(24
)
—
(
3
)
Settlements with
taxing authorities
(10
)
(65
)
(142
)
Balance,
December 31
$
1,251
$
1,185
$
1,450