Comcast 2010 Annual Report Download - page 48
Download and view the complete annual report
Please find page 48 of the 2010 Comcast annual report below. You can navigate through the pages in the report by either clicking on the pages listed below, or by using the keyword search tool below to find specific information within the annual report.-
 1
1 -
2
-
3
-
4
-
5
-
6
-
7
-
8
-
9
-
10
-
11
-
12
-
13
-
14
-
15
-
16
-
17
-
18
-
19
-
20
-
21
-
22
-
23
-
24
-
25
-
26
-
27
-
28
-
29
-
30
-
31
-
32
-
33
-
34
-
35
-
36
-
37
-
 38
38 -
 39
39 -
 40
40 -
 41
41 -
 42
42 -
 43
43 -
 44
44 -
 45
45 -
 46
46 -
 47
47 -
 48
48 -
 49
49 -
 50
50 -
 51
51 -
 52
52 -
 53
53 -
 54
54 -
 55
55 -
 56
56 -
 57
57 -
 58
58 -
59
-
60
-
61
-
62
-
63
-
64
-
65
-
66
-
67
-
68
-
69
-
70
-
71
-
72
-
73
-
74
-
75
-
76
-
77
-
78
-
79
-
80
-
81
-
82
-
83
-
84
-
85
-
86
-
87
-
88
-
89
-
90
-
91
-
92
-
93
-
94
-
95
-
96
-
97
-
98
-
99
-
100
-
101
-
102
-
103
-
104
-
105
-
106
-
107
-
108
-
109
-
110
-
111
-
112
-
113
-
114
-
115
-
116
-
117
-
118
-
119
-
120
-
121
-
122
-
123
-
124
-
125
-
126
-
127
-
128
-
129
-
130
-
131
-
132
-
133
-
134
-
135
-
136
-
137
-
138
-
139
-
140
-
141
-
142
-
143
-
144
-
145
-
146
-
147
-
148
-
149
-
150
-
151
-
152
-
153
-
154
-
155
-
156
-
157
-
158
-
159
-
160
-
161
-
162
-
163
-
164
-
165
-
166
-
167
-
168
-
169
-
170
-
171
-
172
-
173
-
174
-
175
-
176
-
177
-
178
-
179
-
180
-
181
-
182
-
183
-
184
-
185
-
186
-
187
-
188
-
189
-
190
-
191
-
192
-
193
-
194
-
195
-
196
-
197
-
198
-
199
-
200
-
201
-
202
-
203
-
204
-
205
-
206
-
207
-
208
-
209
-
210
-
211
-
212
-
213
-
214
-
215
-
216
-
217
-
218
-
219
-
220
-
221
-
222
-
223
-
224
-
225
-
226
-
227
-
228
-
229
-
230
-
231
-
232
-
233
-
234
-
235
-
236
-
237
-
238
-
239
-
240
-
241
-
242
-
243
-
244
-
245
-
246
-
247
-
248
-
249
-
250
-
251
-
252
-
253
-
254
-
255
-
256
-
257
-
258
-
259
-
260
-
261
-
262
-
263
-
264
-
265
-
266
-
267
-
268
-
269
-
270
-
271
-
272
-
273
-
274
-
275
-
276
-
277
-
278
-
279
-
280
-
281
-
282
-
283
-
284
-
285
-
286
-
287
-
288
-
289
-
290
-
291
-
292
-
293
-
294
-
295
-
296
-
297
-
298
-
299
-
300
-
301
-
302
-
303
-
304
-
305
-
306
-
307
-
308
-
309
-
310
-
311
-
312
-
313
-
314
-
315
-
316
-
317
-
318
-
319
-
320
-
321
-
322
-
323
-
324
-
325
-
326
-
327
-
328
-
329
-
330
-
331
-
332
-
333
-
334
-
335
-
336
-
337
-
338
-
339
-
340
-
341
-
342
-
343
-
344
-
345
-
346
-
347
-
348
-
349
-
350
-
351
 |
 |

Table of Contents
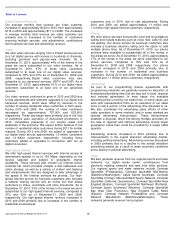
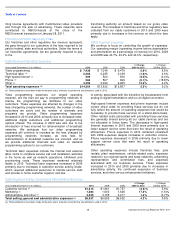
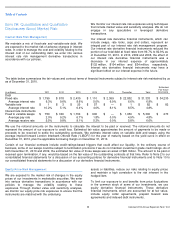
Programming Segment Overview
As of December 31, 2010, our Programming segment consisted primarily of our consolidated national programming networks. The
businesses in our Programming segment were contributed to NBCUniversal at the close of the NBCUniversal transaction on
January 28, 2011. The table below presents a summary of our consolidated national programming networks.
Programming Segment Results of Operations
Programming Network
Approximate
U.S. Subscribers at
December 31, 2010
(in millions)
Description of Programming
E!
98
Entertainment and pop culture
Golf Channel
83
Golf competition and golf entertainment
VERSUS
75
Sports and leisure
Style
66
Lifestyle
G4
59
Gamer lifestyle
(a)
Subscriber data based on The Nielsen Company’s January 2011 report, which covers that period from December 15, 2010 through December 21, 2010.
Year ended December 31 (in millions)
2010
2009
2008
% Change
2009 to 2010
% Change
2008 to 2009
Revenue
$
1,674
$
1,496
$
1,426
11.8
%
4.9
%
Operating, selling, general and administrative
1,205
1,107
1,064
8.7
%
4.0
%
Operating income before depreciation and amortization
$
469
$
389
$
362
20.6
%
7.5
%
Comcast 2010 Annual Report on Form 10-K
42
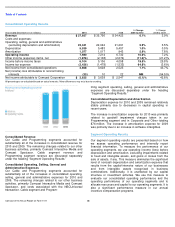
Customer service expenses decreased in 2010 primarily due
to operating efficiencies, higher levels of activity in 2009
related to the transition by broadcasters from analog to digital
transmission and our all digital conversion. Customer service
expenses increased in 2009 primarily due to activity
associated with the transition by broadcasters from analog to
digital transmission and our all digital conversion.
Marketing expenses increased in 2010 primarily due to an
increase in direct sales efforts and additional marketing costs
associated with attracting and retaining customers, as well as
the launch of
our Xfinity brand. Marketing expenses decreased in 2009
primarily due to lower costs and volume for media
advertising, partially offset by an increase in direct sales
efforts.
During 2010, 2009 and 2008, we implemented personnel and
cost reduction programs that were focused on streamlining
our Cable operations. In connection with these initiatives, we
recorded $66 million, $81 million and $126 million of
severance costs during 2010, 2009 and 2008, respectively.
Administrative and other expenses decreased in 2009
primarily due to the impact of the programs initiated in 2008.
(a)
Programming Segment Revenue
Programming revenue increased in 2010 and 2009 primarily
due to growth in advertising revenue and programming
license fee revenue. In 2010, 2009 and 2008, advertising
accounted for approximately 40%, 41% and 43%,
respectively, of total Programming revenue. In 2010, 2009
and 2008, approximately 12% of our Programming revenue
was generated from our Cable segment. These amounts are
eliminated in our consolidated financial statements but are
included in the amounts presented above.
Programming Segment Operating, Selling, General and
Administrative Expenses
Programming operating, selling, general and administrative
expenses consist mainly of the cost of producing television
programs and live events, the purchase of programming
rights, the marketing and promotion of our programming
networks, and administrative costs.