Comcast 2010 Annual Report Download - page 69
Download and view the complete annual report
Please find page 69 of the 2010 Comcast annual report below. You can navigate through the pages in the report by either clicking on the pages listed below, or by using the keyword search tool below to find specific information within the annual report.-
 1
1 -
2
-
3
-
4
-
5
-
6
-
7
-
8
-
9
-
10
-
11
-
12
-
13
-
14
-
15
-
16
-
17
-
18
-
19
-
20
-
21
-
22
-
23
-
24
-
25
-
26
-
27
-
28
-
29
-
30
-
31
-
32
-
33
-
34
-
35
-
36
-
37
-
38
-
39
-
40
-
41
-
42
-
43
-
44
-
45
-
46
-
47
-
48
-
49
-
50
-
51
-
52
-
53
-
54
-
55
-
56
-
57
-
58
-
 59
59 -
 60
60 -
 61
61 -
 62
62 -
 63
63 -
 64
64 -
 65
65 -
 66
66 -
 67
67 -
 68
68 -
 69
69 -
 70
70 -
 71
71 -
 72
72 -
 73
73 -
 74
74 -
 75
75 -
 76
76 -
 77
77 -
 78
78 -
 79
79 -
80
-
81
-
82
-
83
-
84
-
85
-
86
-
87
-
88
-
89
-
90
-
91
-
92
-
93
-
94
-
95
-
96
-
97
-
98
-
99
-
100
-
101
-
102
-
103
-
104
-
105
-
106
-
107
-
108
-
109
-
110
-
111
-
112
-
113
-
114
-
115
-
116
-
117
-
118
-
119
-
120
-
121
-
122
-
123
-
124
-
125
-
126
-
127
-
128
-
129
-
130
-
131
-
132
-
133
-
134
-
135
-
136
-
137
-
138
-
139
-
140
-
141
-
142
-
143
-
144
-
145
-
146
-
147
-
148
-
149
-
150
-
151
-
152
-
153
-
154
-
155
-
156
-
157
-
158
-
159
-
160
-
161
-
162
-
163
-
164
-
165
-
166
-
167
-
168
-
169
-
170
-
171
-
172
-
173
-
174
-
175
-
176
-
177
-
178
-
179
-
180
-
181
-
182
-
183
-
184
-
185
-
186
-
187
-
188
-
189
-
190
-
191
-
192
-
193
-
194
-
195
-
196
-
197
-
198
-
199
-
200
-
201
-
202
-
203
-
204
-
205
-
206
-
207
-
208
-
209
-
210
-
211
-
212
-
213
-
214
-
215
-
216
-
217
-
218
-
219
-
220
-
221
-
222
-
223
-
224
-
225
-
226
-
227
-
228
-
229
-
230
-
231
-
232
-
233
-
234
-
235
-
236
-
237
-
238
-
239
-
240
-
241
-
242
-
243
-
244
-
245
-
246
-
247
-
248
-
249
-
250
-
251
-
252
-
253
-
254
-
255
-
256
-
257
-
258
-
259
-
260
-
261
-
262
-
263
-
264
-
265
-
266
-
267
-
268
-
269
-
270
-
271
-
272
-
273
-
274
-
275
-
276
-
277
-
278
-
279
-
280
-
281
-
282
-
283
-
284
-
285
-
286
-
287
-
288
-
289
-
290
-
291
-
292
-
293
-
294
-
295
-
296
-
297
-
298
-
299
-
300
-
301
-
302
-
303
-
304
-
305
-
306
-
307
-
308
-
309
-
310
-
311
-
312
-
313
-
314
-
315
-
316
-
317
-
318
-
319
-
320
-
321
-
322
-
323
-
324
-
325
-
326
-
327
-
328
-
329
-
330
-
331
-
332
-
333
-
334
-
335
-
336
-
337
-
338
-
339
-
340
-
341
-
342
-
343
-
344
-
345
-
346
-
347
-
348
-
349
-
350
-
351
 |
 |

Table of Contents
Notes to Consolidated Financial Statements
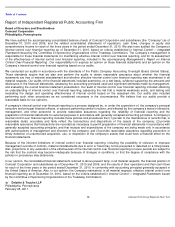
Note 1: Organization and Business
We are a Pennsylvania corporation and were incorporated in
December 2001. Through our predecessors, we have
developed, managed and operated cable systems since
1963. We classify our operations in two reportable segments:
Cable and Programming.
Our Cable segment is primarily involved in the management
and operation of cable systems in the United States. As of
December 31, 2010, we served approximately 22.8 million
video customers, 17.0 million high-speed Internet customers
and 8.6 million phone customers. Our regional sports and
news networks are also included in our Cable segment.
Our Programming segment consists primarily of our
consolidated national cable programming networks, E!, Golf
Channel, VERSUS, G4 and Style.
Our other business interests include Comcast Interactive
Media and Comcast Spectacor. Comcast Interactive Media
develops and operates our Internet businesses, including
Comcast.net, Xfinity TV, Plaxo, Fandango and DailyCandy.
Comcast Spectacor owns two professional sports teams, the
Philadelphia 76ers and the Philadelphia Flyers, and a large,
multipurpose arena in Philadelphia, the Wells Fargo Center,
and provides facilities management and food services for
sporting events, concerts and other events. We also own
equity method investments in other programming networks
and wireless-related companies.
On January 28, 2011, we closed our transaction with General
Electric Company (“GE”) in which we acquired control of the
businesses of NBC Universal Inc. (now named NBCUniversal
Media, LLC (“NBCUniversal”)), a leading media and
entertainment company that develops, produces and
distributes entertainment, news, sports and other content to
global audiences. Beginning in the first quarter of 2011,
NBCUniversal’s results will be included in our consolidated
financial statements. See Note 21 for more information on the
transaction.
Note 2: Summary of Significant Accounting Policies
Basis of Consolidation
The accompanying consolidated financial statements include
(i) all of our accounts, (ii) all entities in which we have a
controlling voting interest (“subsidiaries”) and (iii) variable
interest entities (“VIEs”) required to be consolidated in
accordance with generally accepted accounting principles in
the United States (“GAAP”). We have eliminated
intercompany accounts and transactions among consolidated
entities.
Our Use of Estimates
We prepare our consolidated financial statements in
conformity with GAAP, which requires us to make estimates
and assumptions that affect the reported amounts and
disclosures. Actual results could differ from those estimates.
Estimates are used when accounting for various items, such
as allowances for doubtful accounts, investments, derivative
financial instruments, asset impairments, nonmonetary
transactions, certain acquisition-related liabilities,
programming-related liabilities, pensions and other
postretirement benefits, revenue recognition, depreciation
and amortization, income taxes, legal contingencies, and
other contingent liabilities. See Note 11 for our discussion on
fair value estimates.
Cash Equivalents
The carrying amounts of our cash equivalents approximate
their fair value. Our cash equivalents consist primarily of
money market funds and U.S. government obligations, as
well as commercial paper and certificates of deposit with
maturities of less than three months when purchased.
Investments
We classify publicly traded investments as available-for-sale
(“AFS”) or trading securities and record them at fair value.
For AFS securities, we record unrealized gains or losses
resulting from changes in fair value between measurement
dates as a component of other comprehensive income (loss),
except when we consider declines in value to be other than
temporary. For trading securities, we record unrealized gains
or losses resulting from changes in fair value between
measurement dates as a component of investment income
(loss), net. We recognize realized gains and losses
associated with our fair value method investments using the
specific identification method. We classify the cash flows
related to purchases of and proceeds from the sale of trading
securities based on the nature of the securities and purpose
for which they were acquired. Investments in privately held
companies are generally stated at cost.
We use the equity method to account for investments in
which we have the ability to exercise significant influence
over the investee’s operating and financial policies. Equity
method investments are recorded at cost and are adjusted to
recognize (i) our proportionate share of the investee’s net
income or losses after the date of investment,
(ii) amortization of basis differences, (iii) additional
contributions made and dividends received, and
(iv) impairments resulting from other-than-temporary declines
in fair value. We generally record our share of the investee’s
net income or loss one quarter in arrears due to the timing of
our receipt of such information. Gains or losses on the sale of
equity method investments are recorded to other income
(expense).
We review our investment portfolio each reporting period to
determine whether there are identified events or
circumstances that would indicate there is a decline in the fair
value that is