Comcast 2010 Annual Report Download - page 55
Download and view the complete annual report
Please find page 55 of the 2010 Comcast annual report below. You can navigate through the pages in the report by either clicking on the pages listed below, or by using the keyword search tool below to find specific information within the annual report.-
 1
1 -
2
-
3
-
4
-
5
-
6
-
7
-
8
-
9
-
10
-
11
-
12
-
13
-
14
-
15
-
16
-
17
-
18
-
19
-
20
-
21
-
22
-
23
-
24
-
25
-
26
-
27
-
28
-
29
-
30
-
31
-
32
-
33
-
34
-
35
-
36
-
37
-
38
-
39
-
40
-
41
-
42
-
43
-
44
-
 45
45 -
 46
46 -
 47
47 -
 48
48 -
 49
49 -
 50
50 -
 51
51 -
 52
52 -
 53
53 -
 54
54 -
 55
55 -
 56
56 -
 57
57 -
 58
58 -
 59
59 -
 60
60 -
 61
61 -
 62
62 -
 63
63 -
 64
64 -
 65
65 -
66
-
67
-
68
-
69
-
70
-
71
-
72
-
73
-
74
-
75
-
76
-
77
-
78
-
79
-
80
-
81
-
82
-
83
-
84
-
85
-
86
-
87
-
88
-
89
-
90
-
91
-
92
-
93
-
94
-
95
-
96
-
97
-
98
-
99
-
100
-
101
-
102
-
103
-
104
-
105
-
106
-
107
-
108
-
109
-
110
-
111
-
112
-
113
-
114
-
115
-
116
-
117
-
118
-
119
-
120
-
121
-
122
-
123
-
124
-
125
-
126
-
127
-
128
-
129
-
130
-
131
-
132
-
133
-
134
-
135
-
136
-
137
-
138
-
139
-
140
-
141
-
142
-
143
-
144
-
145
-
146
-
147
-
148
-
149
-
150
-
151
-
152
-
153
-
154
-
155
-
156
-
157
-
158
-
159
-
160
-
161
-
162
-
163
-
164
-
165
-
166
-
167
-
168
-
169
-
170
-
171
-
172
-
173
-
174
-
175
-
176
-
177
-
178
-
179
-
180
-
181
-
182
-
183
-
184
-
185
-
186
-
187
-
188
-
189
-
190
-
191
-
192
-
193
-
194
-
195
-
196
-
197
-
198
-
199
-
200
-
201
-
202
-
203
-
204
-
205
-
206
-
207
-
208
-
209
-
210
-
211
-
212
-
213
-
214
-
215
-
216
-
217
-
218
-
219
-
220
-
221
-
222
-
223
-
224
-
225
-
226
-
227
-
228
-
229
-
230
-
231
-
232
-
233
-
234
-
235
-
236
-
237
-
238
-
239
-
240
-
241
-
242
-
243
-
244
-
245
-
246
-
247
-
248
-
249
-
250
-
251
-
252
-
253
-
254
-
255
-
256
-
257
-
258
-
259
-
260
-
261
-
262
-
263
-
264
-
265
-
266
-
267
-
268
-
269
-
270
-
271
-
272
-
273
-
274
-
275
-
276
-
277
-
278
-
279
-
280
-
281
-
282
-
283
-
284
-
285
-
286
-
287
-
288
-
289
-
290
-
291
-
292
-
293
-
294
-
295
-
296
-
297
-
298
-
299
-
300
-
301
-
302
-
303
-
304
-
305
-
306
-
307
-
308
-
309
-
310
-
311
-
312
-
313
-
314
-
315
-
316
-
317
-
318
-
319
-
320
-
321
-
322
-
323
-
324
-
325
-
326
-
327
-
328
-
329
-
330
-
331
-
332
-
333
-
334
-
335
-
336
-
337
-
338
-
339
-
340
-
341
-
342
-
343
-
344
-
345
-
346
-
347
-
348
-
349
-
350
-
351
 |
 |

Table of Contents
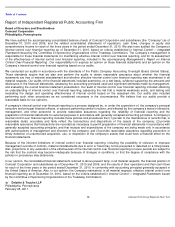
Critical Accounting Judgments and Estimates
The preparation of our financial statements requires us to
make estimates that affect the reported amounts of assets,
liabilities, revenue and expenses, and the related disclosure
of contingent assets and contingent liabilities. We base our
judgments on our historical experience and on various other
assumptions that we believe are reasonable under the
circumstances, the results of which form the basis for making
estimates about the carrying values of assets and liabilities
that are not readily apparent from other sources. Actual
results may differ from these estimates under different
assumptions or conditions.
We believe our judgments and related estimates associated
with the valuation and impairment testing of our cable
franchise rights and the accounting for income taxes are
critical in the preparation of our financial statements.
Management has discussed the development and selection
of these critical accounting judgments and estimates with the
Audit Committee of our Board of Directors, and the Audit
Committee has reviewed our disclosures relating to them,
which are presented below.
Refer to Note 2 to our consolidated financial statements for a
discussion of our accounting policies with respect to these
and other items.
Valuation and Impairment Testing of Cable Franchise
Rights
Our largest asset, our cable franchise rights, results from
agreements we have with state and local governments that
allow us to construct and operate a cable business within a
specified geographic area. The value of a franchise is derived
from the economic benefits we receive from the right to solicit
new customers and to market new services, such as
advanced video services and high-speed Internet and phone
services, in a particular service area. The amounts we record
for cable franchise rights are primarily a result of cable
system acquisitions. Typically when we acquire a cable
system, the most significant asset we record is the value of
the cable franchise rights. Often these cable system
acquisitions include multiple franchise areas. We currently
serve approximately 6,400 franchise areas in the United
States.
We have concluded that our cable franchise rights have an
indefinite useful life since there are no legal, regulatory,
contractual, competitive, economic or other factors which limit
the period over which these rights will contribute to our cash
flows. Accordingly, we do not amortize our cable franchise
rights but assess the carrying value of our cable franchise
rights annually, or more frequently whenever events or
changes in circumstances indicate that the carrying amount
may exceed the fair value (“impairment testing”). We
estimate the fair value of our cable franchise rights primarily
based on a discounted cash flow analysis that involves
significant judgment. When analyzing the fair values
indicated under the discounted cash flow models, we also
consider multiples of operating income before depreciation
and amortization generated by under-
lying assets, current market transactions and profitability
information.
If we were to determine that the value of our cable franchise
rights was less than the carrying amount, we would recognize
an impairment charge for the difference between the
estimated fair value and the carrying value of the assets. For
purposes of our impairment testing, we have grouped the
recorded values of our various cable franchise rights into our
Cable divisions or units of account. We evaluate the unit of
account periodically to ensure our impairment testing is
performed at an appropriate level.
Since the adoption of the accounting guidance related to
goodwill and intangible assets in 2002, we have not recorded
any significant impairment charges to cable franchise rights
as a result of our impairment testing. A future change in the
unit of account could result in the recognition of an
impairment charge.
We could also record impairment charges in the future if
there are changes in long-term market conditions, in
expected future operating results, or in federal or state
regulations that prevent us from recovering the carrying value
of these cable franchise rights. Assumptions made about
increased competition and economic conditions could also
impact the valuations used in future annual impairment
testing and result in a reduction of fair values from those
determined in the July 1, 2010 annual impairment testing.
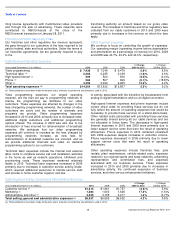
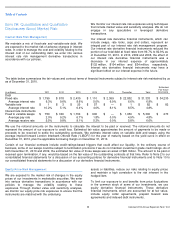
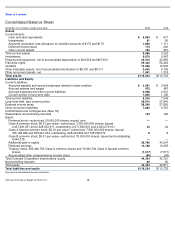
The table below illustrates the impairment related to our
Cable divisions that would have occurred had the
hypothetical reductions in fair value existed at the time of our
last annual impairment testing.
The Cable divisions represent the unit of account we use to
test for impairment. In November 2010, our Cable division
management structure was reorganized from four divisions to
three, with certain regions from the prior divisions being
moved to a different division within the new management
structure. We re-performed our impairment testing
immediately before the reorganization and no impairment
was indicated.
Income Taxes
We base our provision for income taxes on our current period
income, changes in our deferred income tax assets and
liabilities, income tax rates, changes in estimates of our
uncertain tax posi-
Percent Hypothetical Reduction in Fair Value and Related
Impairment
(in millions)
10%
15%
20%
25%
Eastern
Division
$
(711
)
$
(1,566
)
$
(2,421
)
$
(3,276
)
NorthCentral
Division
—
(
843
)
(1,778
)
(2,713
)
Southern
Division
—
—
—
—
West
Division
—
—
—
(
869
)
$
(711
)
$
(2,409
)
$
(4,199
)
$
(6,858
)