Comcast 2010 Annual Report Download - page 78
Download and view the complete annual report
Please find page 78 of the 2010 Comcast annual report below. You can navigate through the pages in the report by either clicking on the pages listed below, or by using the keyword search tool below to find specific information within the annual report.-
 1
1 -
2
-
3
-
4
-
5
-
6
-
7
-
8
-
9
-
10
-
11
-
12
-
13
-
14
-
15
-
16
-
17
-
18
-
19
-
20
-
21
-
22
-
23
-
24
-
25
-
26
-
27
-
28
-
29
-
30
-
31
-
32
-
33
-
34
-
35
-
36
-
37
-
38
-
39
-
40
-
41
-
42
-
43
-
44
-
45
-
46
-
47
-
48
-
49
-
50
-
51
-
52
-
53
-
54
-
55
-
56
-
57
-
58
-
59
-
60
-
61
-
62
-
63
-
64
-
65
-
66
-
67
-
 68
68 -
 69
69 -
 70
70 -
 71
71 -
 72
72 -
 73
73 -
 74
74 -
 75
75 -
 76
76 -
 77
77 -
 78
78 -
 79
79 -
 80
80 -
 81
81 -
 82
82 -
 83
83 -
 84
84 -
 85
85 -
 86
86 -
 87
87 -
 88
88 -
89
-
90
-
91
-
92
-
93
-
94
-
95
-
96
-
97
-
98
-
99
-
100
-
101
-
102
-
103
-
104
-
105
-
106
-
107
-
108
-
109
-
110
-
111
-
112
-
113
-
114
-
115
-
116
-
117
-
118
-
119
-
120
-
121
-
122
-
123
-
124
-
125
-
126
-
127
-
128
-
129
-
130
-
131
-
132
-
133
-
134
-
135
-
136
-
137
-
138
-
139
-
140
-
141
-
142
-
143
-
144
-
145
-
146
-
147
-
148
-
149
-
150
-
151
-
152
-
153
-
154
-
155
-
156
-
157
-
158
-
159
-
160
-
161
-
162
-
163
-
164
-
165
-
166
-
167
-
168
-
169
-
170
-
171
-
172
-
173
-
174
-
175
-
176
-
177
-
178
-
179
-
180
-
181
-
182
-
183
-
184
-
185
-
186
-
187
-
188
-
189
-
190
-
191
-
192
-
193
-
194
-
195
-
196
-
197
-
198
-
199
-
200
-
201
-
202
-
203
-
204
-
205
-
206
-
207
-
208
-
209
-
210
-
211
-
212
-
213
-
214
-
215
-
216
-
217
-
218
-
219
-
220
-
221
-
222
-
223
-
224
-
225
-
226
-
227
-
228
-
229
-
230
-
231
-
232
-
233
-
234
-
235
-
236
-
237
-
238
-
239
-
240
-
241
-
242
-
243
-
244
-
245
-
246
-
247
-
248
-
249
-
250
-
251
-
252
-
253
-
254
-
255
-
256
-
257
-
258
-
259
-
260
-
261
-
262
-
263
-
264
-
265
-
266
-
267
-
268
-
269
-
270
-
271
-
272
-
273
-
274
-
275
-
276
-
277
-
278
-
279
-
280
-
281
-
282
-
283
-
284
-
285
-
286
-
287
-
288
-
289
-
290
-
291
-
292
-
293
-
294
-
295
-
296
-
297
-
298
-
299
-
300
-
301
-
302
-
303
-
304
-
305
-
306
-
307
-
308
-
309
-
310
-
311
-
312
-
313
-
314
-
315
-
316
-
317
-
318
-
319
-
320
-
321
-
322
-
323
-
324
-
325
-
326
-
327
-
328
-
329
-
330
-
331
-
332
-
333
-
334
-
335
-
336
-
337
-
338
-
339
-
340
-
341
-
342
-
343
-
344
-
345
-
346
-
347
-
348
-
349
-
350
-
351
 |
 |

Table of Contents
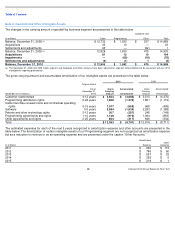
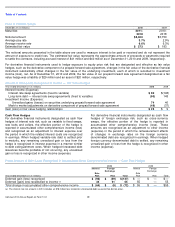
Note 8: Goodwill and Other Intangible Assets
The changes in the carrying amount of goodwill by business segment are presented in the table below.
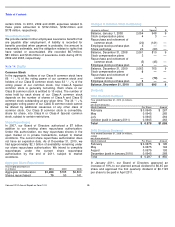
The gross carrying amount and accumulated amortization of our intangible assets are presented in the table below.
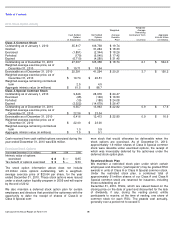
The estimated expenses for each of the next 5 years recognized in amortization expense and other accounts are presented in the
table below. The amortization of certain intangible assets of our Programming segment are not recognized as amortization expense
but as a reduction to revenue or as an operating expense and are presented under the caption “Other Accounts.”
(in millions)
Cable
Programming
Corporate and
Other
Total
Balance, December 31, 2008
$
12,732
$
1,620
$
537
$
14,889
Acquisitions
33
10
—
43
Settlements and adjustments
63
—
(
62
)
1
Balance, December 31, 2009
12,828
1,630
475
14,933
Acquisitions
81
13
10
104
Impairments
—
(
60
)
(16
)
(76
)
Settlements and adjustments
(3
)
(1
)
1
(3
)
Balance, December 31, 2010
$
12,906
$
1,582
$
470
$
14,958
(a)
The December 31, 2008 and 2009 Cable segment and Corporate and Other amounts have been adjusted for segment reclassifications to be consistent with our 2010
management reporting presentation.
2010
2009
December 31 (in millions)
Original Useful
Life at
December 31,
2010
Gross
Carrying
Amount
Accumulated
Amortization
Gross
Carrying
Amount
Accumulated
Amortization
Customer relationships
4
-
12 years
$
5,554
$
(4,682
)
$
5,515
$
(4,370
)
Programming distribution rights
6
-
22 years
1,858
(1,278
)
1,861
(1,119
)
Cable franchise renewal costs and contractual operating
rights
5-
15 years
1,077
(608
)
968
(499
)
Software
3-
5 years
2,594
(1,624
)
2,283
(1,388
)
Patents and other technology rights
3-
12 years
307
(207
)
246
(148
)
Programming agreements and rights
1
-
10 years
1,149
(975
)
1,094
(853
)
Other agreements and rights
2
-
25 years
854
(417
)
849
(334
)
Total
$
13,393
$
(9,791
)
$
12,816
$
(8,711
)
(in millions)
Amortization
Expense
Other
Accounts
2011
$
906
$
115
2012
$
786
$
60
2013
$
557
$
25
2014
$
358
$
6
2015
$
218
$
1
69
Comcast 2010 Annual Report on Form 10-
K
(a)
(a)