Comcast 2010 Annual Report Download - page 65
Download and view the complete annual report
Please find page 65 of the 2010 Comcast annual report below. You can navigate through the pages in the report by either clicking on the pages listed below, or by using the keyword search tool below to find specific information within the annual report.-
 1
1 -
2
-
3
-
4
-
5
-
6
-
7
-
8
-
9
-
10
-
11
-
12
-
13
-
14
-
15
-
16
-
17
-
18
-
19
-
20
-
21
-
22
-
23
-
24
-
25
-
26
-
27
-
28
-
29
-
30
-
31
-
32
-
33
-
34
-
35
-
36
-
37
-
38
-
39
-
40
-
41
-
42
-
43
-
44
-
45
-
46
-
47
-
48
-
49
-
50
-
51
-
52
-
53
-
54
-
 55
55 -
 56
56 -
 57
57 -
 58
58 -
 59
59 -
 60
60 -
 61
61 -
 62
62 -
 63
63 -
 64
64 -
 65
65 -
 66
66 -
 67
67 -
 68
68 -
 69
69 -
 70
70 -
 71
71 -
 72
72 -
 73
73 -
 74
74 -
 75
75 -
76
-
77
-
78
-
79
-
80
-
81
-
82
-
83
-
84
-
85
-
86
-
87
-
88
-
89
-
90
-
91
-
92
-
93
-
94
-
95
-
96
-
97
-
98
-
99
-
100
-
101
-
102
-
103
-
104
-
105
-
106
-
107
-
108
-
109
-
110
-
111
-
112
-
113
-
114
-
115
-
116
-
117
-
118
-
119
-
120
-
121
-
122
-
123
-
124
-
125
-
126
-
127
-
128
-
129
-
130
-
131
-
132
-
133
-
134
-
135
-
136
-
137
-
138
-
139
-
140
-
141
-
142
-
143
-
144
-
145
-
146
-
147
-
148
-
149
-
150
-
151
-
152
-
153
-
154
-
155
-
156
-
157
-
158
-
159
-
160
-
161
-
162
-
163
-
164
-
165
-
166
-
167
-
168
-
169
-
170
-
171
-
172
-
173
-
174
-
175
-
176
-
177
-
178
-
179
-
180
-
181
-
182
-
183
-
184
-
185
-
186
-
187
-
188
-
189
-
190
-
191
-
192
-
193
-
194
-
195
-
196
-
197
-
198
-
199
-
200
-
201
-
202
-
203
-
204
-
205
-
206
-
207
-
208
-
209
-
210
-
211
-
212
-
213
-
214
-
215
-
216
-
217
-
218
-
219
-
220
-
221
-
222
-
223
-
224
-
225
-
226
-
227
-
228
-
229
-
230
-
231
-
232
-
233
-
234
-
235
-
236
-
237
-
238
-
239
-
240
-
241
-
242
-
243
-
244
-
245
-
246
-
247
-
248
-
249
-
250
-
251
-
252
-
253
-
254
-
255
-
256
-
257
-
258
-
259
-
260
-
261
-
262
-
263
-
264
-
265
-
266
-
267
-
268
-
269
-
270
-
271
-
272
-
273
-
274
-
275
-
276
-
277
-
278
-
279
-
280
-
281
-
282
-
283
-
284
-
285
-
286
-
287
-
288
-
289
-
290
-
291
-
292
-
293
-
294
-
295
-
296
-
297
-
298
-
299
-
300
-
301
-
302
-
303
-
304
-
305
-
306
-
307
-
308
-
309
-
310
-
311
-
312
-
313
-
314
-
315
-
316
-
317
-
318
-
319
-
320
-
321
-
322
-
323
-
324
-
325
-
326
-
327
-
328
-
329
-
330
-
331
-
332
-
333
-
334
-
335
-
336
-
337
-
338
-
339
-
340
-
341
-
342
-
343
-
344
-
345
-
346
-
347
-
348
-
349
-
350
-
351
 |
 |

Table of Contents
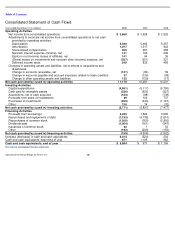
Consolidated Statement of Cash Flows
See notes to consolidated financial statements.
Year ended December 31 (in millions)
2010
2009
2008
Operating Activities
Net income from consolidated operations
$
3,668
$
3,628
$
2,525
Adjustments to reconcile net income from consolidated operations to net cash
provided by operating activities:
Depreciation
5,539
5,483
5,457
Amortization
1,077
1,017
943
Share-based compensation
300
257
258
Noncash interest expense (income), net
141
160
209
Equity in net (income) losses of affiliates, net
141
64
39
(Gains) losses on investments and noncash other (income) expense, net
(267
)
(201
)
321
Deferred income taxes
549
832
495
Changes in operating assets and liabilities, net of effects of acquisitions and
divestitures:
Change in accounts receivable, net
(131
)
(84
)
39
Change in accounts payable and accrued expenses related to trade creditors
37
(136
)
(38
)
Change in other operating assets and liabilities
125
(739
)
(17
)
Net cash provided by (used in) operating activities
11,179
10,281
10,231
Investing Activities
Capital expenditures
(4,961
)
(5,117
)
(5,750
)
Cash paid for intangible assets
(536
)
(522
)
(527
)
Acquisitions, net of cash acquired
(183
)
(88
)
(738
)
Proceeds from sales of investments
99
102
737
Purchases of investments
(260
)
(346
)
(1,167
)
Other
130
74
(32
)
Net cash provided by (used in) investing activities
(5,711
)
(5,897
)
(7,477
)
Financing Activities
Proceeds from borrowings
3,420
1,564
3,535
Repurchases and repayments of debt
(1,153
)
(4,738
)
(2,610
)
Repurchases of common stock
(1,200
)
(765
)
(2,800
)
Dividends paid
(1,064
)
(761
)
(547
)
Issuances of common stock
34
1
53
Other
(192
)
(209
)
(153
)
Net cash provided by (used in) financing activities
(155
)
(4,908
)
(2,522
)
Increase (decrease) in cash and cash equivalents
5,313
(524
)
232
Cash and cash equivalents, beginning of year
671
1,195
963
Cash and cash equivalents, end of year
$
5,984
$
671
$
1,195
Comcast 2010 Annual Report on Form 10-K
58