Comcast 2010 Annual Report Download - page 77
Download and view the complete annual report
Please find page 77 of the 2010 Comcast annual report below. You can navigate through the pages in the report by either clicking on the pages listed below, or by using the keyword search tool below to find specific information within the annual report.-
 1
1 -
2
-
3
-
4
-
5
-
6
-
7
-
8
-
9
-
10
-
11
-
12
-
13
-
14
-
15
-
16
-
17
-
18
-
19
-
20
-
21
-
22
-
23
-
24
-
25
-
26
-
27
-
28
-
29
-
30
-
31
-
32
-
33
-
34
-
35
-
36
-
37
-
38
-
39
-
40
-
41
-
42
-
43
-
44
-
45
-
46
-
47
-
48
-
49
-
50
-
51
-
52
-
53
-
54
-
55
-
56
-
57
-
58
-
59
-
60
-
61
-
62
-
63
-
64
-
65
-
66
-
 67
67 -
 68
68 -
 69
69 -
 70
70 -
 71
71 -
 72
72 -
 73
73 -
 74
74 -
 75
75 -
 76
76 -
 77
77 -
 78
78 -
 79
79 -
 80
80 -
 81
81 -
 82
82 -
 83
83 -
 84
84 -
 85
85 -
 86
86 -
 87
87 -
88
-
89
-
90
-
91
-
92
-
93
-
94
-
95
-
96
-
97
-
98
-
99
-
100
-
101
-
102
-
103
-
104
-
105
-
106
-
107
-
108
-
109
-
110
-
111
-
112
-
113
-
114
-
115
-
116
-
117
-
118
-
119
-
120
-
121
-
122
-
123
-
124
-
125
-
126
-
127
-
128
-
129
-
130
-
131
-
132
-
133
-
134
-
135
-
136
-
137
-
138
-
139
-
140
-
141
-
142
-
143
-
144
-
145
-
146
-
147
-
148
-
149
-
150
-
151
-
152
-
153
-
154
-
155
-
156
-
157
-
158
-
159
-
160
-
161
-
162
-
163
-
164
-
165
-
166
-
167
-
168
-
169
-
170
-
171
-
172
-
173
-
174
-
175
-
176
-
177
-
178
-
179
-
180
-
181
-
182
-
183
-
184
-
185
-
186
-
187
-
188
-
189
-
190
-
191
-
192
-
193
-
194
-
195
-
196
-
197
-
198
-
199
-
200
-
201
-
202
-
203
-
204
-
205
-
206
-
207
-
208
-
209
-
210
-
211
-
212
-
213
-
214
-
215
-
216
-
217
-
218
-
219
-
220
-
221
-
222
-
223
-
224
-
225
-
226
-
227
-
228
-
229
-
230
-
231
-
232
-
233
-
234
-
235
-
236
-
237
-
238
-
239
-
240
-
241
-
242
-
243
-
244
-
245
-
246
-
247
-
248
-
249
-
250
-
251
-
252
-
253
-
254
-
255
-
256
-
257
-
258
-
259
-
260
-
261
-
262
-
263
-
264
-
265
-
266
-
267
-
268
-
269
-
270
-
271
-
272
-
273
-
274
-
275
-
276
-
277
-
278
-
279
-
280
-
281
-
282
-
283
-
284
-
285
-
286
-
287
-
288
-
289
-
290
-
291
-
292
-
293
-
294
-
295
-
296
-
297
-
298
-
299
-
300
-
301
-
302
-
303
-
304
-
305
-
306
-
307
-
308
-
309
-
310
-
311
-
312
-
313
-
314
-
315
-
316
-
317
-
318
-
319
-
320
-
321
-
322
-
323
-
324
-
325
-
326
-
327
-
328
-
329
-
330
-
331
-
332
-
333
-
334
-
335
-
336
-
337
-
338
-
339
-
340
-
341
-
342
-
343
-
344
-
345
-
346
-
347
-
348
-
349
-
350
-
351
 |
 |

Table of Contents
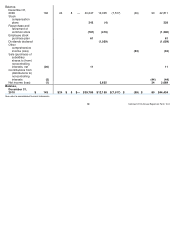
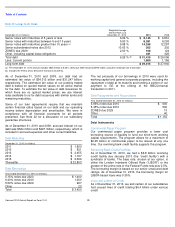
Investment Income (Loss), Net
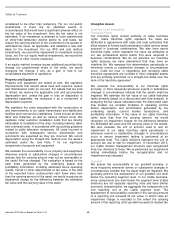
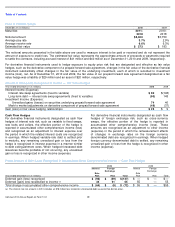
Note 7: Property and Equipment
In 2010, we performed an evaluation of our asset base, resulting in the removal of fully depreciated assets no longer in service. We
also made adjustments within property and equipment that resulted in changes in the prior year amounts classified in the cable
distribution system, customer premises equipment and vehicles and other equipment categories. These adjustments did not affect
prior year property and equipment, net.
Year ended December 31 (in millions)
2010
2009
2008
Gains on sales and exchanges of investments, net
$
13
$
28
$
8
Investment impairment losses
(24
)
(44
)
(28
)
Unrealized gains (losses) on securities underlying prepaid forward sale agreements
874
997
(1,117
)
Mark to market adjustments on derivative component of prepaid forward sale agreements
(672
)
(815
)
1,120
Mark to market adjustments on derivative component of ZONES
7
8
57
Interest and dividend income
94
102
149
Other, net
(4
)
6
(100
)
Investment income (loss), net
$
288
$
282
$
89
December 31 (in millions)
Weighted Average Original Useful Life
at December 31, 2010
2010
2009
Cable distribution system
11 years
$
27,727
$
24,540
Customer premises equipment
6 years
21,716
19,639
Vehicles and other equipment
6 years
4,392
5,343
Buildings and building improvements
20 years
1,981
1,937
Land
—
204
206
Property and equipment, at cost
56,020
51,665
Less: Accumulated depreciation
(32,505
)
(27,810
)
Property and equipment, net
$
23,515
$
23,855
Comcast 2010 Annual Report on Form 10-K
68
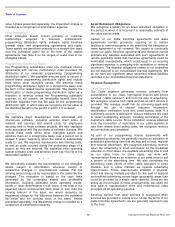
Cost Method
AirTouch Communications, Inc.
We hold two series of preferred stock of AirTouch
Communications, Inc. (“AirTouch”), a subsidiary of Vodafone,
which are redeemable in April 2020. The estimated fair value
of the AirTouch preferred stock was $1.652 billion and $1.524
billion as of December 31, 2010 and 2009, respectively.
The dividend and redemption activity of the AirTouch
preferred stock determines the dividend and redemption
payments associated with substantially all of the preferred
shares issued by one of our con-
solidated subsidiaries, which is a VIE. The subsidiary has
three series of preferred stock outstanding with an aggregate
redemption value of $1.750 billion. Substantially all of the
preferred shares are redeemable in April 2020 at a
redemption value of $1.650 billion. As of December 31, 2010
and 2009, the two redeemable series of subsidiary preferred
shares were recorded at $1.492 billion and $1.479 billion,
respectively, and those amounts are included in other
noncurrent liabilities. The one nonredeemable series of
subsidiary preferred shares was recorded at $100 million as
of both December 31, 2010 and 2009 and those amounts are
included in noncontrolling interests in our consolidated
balance sheet.