Comcast 2010 Annual Report Download - page 86
Download and view the complete annual report
Please find page 86 of the 2010 Comcast annual report below. You can navigate through the pages in the report by either clicking on the pages listed below, or by using the keyword search tool below to find specific information within the annual report.-
 1
1 -
2
-
3
-
4
-
5
-
6
-
7
-
8
-
9
-
10
-
11
-
12
-
13
-
14
-
15
-
16
-
17
-
18
-
19
-
20
-
21
-
22
-
23
-
24
-
25
-
26
-
27
-
28
-
29
-
30
-
31
-
32
-
33
-
34
-
35
-
36
-
37
-
38
-
39
-
40
-
41
-
42
-
43
-
44
-
45
-
46
-
47
-
48
-
49
-
50
-
51
-
52
-
53
-
54
-
55
-
56
-
57
-
58
-
59
-
60
-
61
-
62
-
63
-
64
-
65
-
66
-
67
-
68
-
69
-
70
-
71
-
72
-
73
-
74
-
75
-
 76
76 -
 77
77 -
 78
78 -
 79
79 -
 80
80 -
 81
81 -
 82
82 -
 83
83 -
 84
84 -
 85
85 -
 86
86 -
 87
87 -
 88
88 -
 89
89 -
 90
90 -
 91
91 -
 92
92 -
 93
93 -
 94
94 -
 95
95 -
 96
96 -
97
-
98
-
99
-
100
-
101
-
102
-
103
-
104
-
105
-
106
-
107
-
108
-
109
-
110
-
111
-
112
-
113
-
114
-
115
-
116
-
117
-
118
-
119
-
120
-
121
-
122
-
123
-
124
-
125
-
126
-
127
-
128
-
129
-
130
-
131
-
132
-
133
-
134
-
135
-
136
-
137
-
138
-
139
-
140
-
141
-
142
-
143
-
144
-
145
-
146
-
147
-
148
-
149
-
150
-
151
-
152
-
153
-
154
-
155
-
156
-
157
-
158
-
159
-
160
-
161
-
162
-
163
-
164
-
165
-
166
-
167
-
168
-
169
-
170
-
171
-
172
-
173
-
174
-
175
-
176
-
177
-
178
-
179
-
180
-
181
-
182
-
183
-
184
-
185
-
186
-
187
-
188
-
189
-
190
-
191
-
192
-
193
-
194
-
195
-
196
-
197
-
198
-
199
-
200
-
201
-
202
-
203
-
204
-
205
-
206
-
207
-
208
-
209
-
210
-
211
-
212
-
213
-
214
-
215
-
216
-
217
-
218
-
219
-
220
-
221
-
222
-
223
-
224
-
225
-
226
-
227
-
228
-
229
-
230
-
231
-
232
-
233
-
234
-
235
-
236
-
237
-
238
-
239
-
240
-
241
-
242
-
243
-
244
-
245
-
246
-
247
-
248
-
249
-
250
-
251
-
252
-
253
-
254
-
255
-
256
-
257
-
258
-
259
-
260
-
261
-
262
-
263
-
264
-
265
-
266
-
267
-
268
-
269
-
270
-
271
-
272
-
273
-
274
-
275
-
276
-
277
-
278
-
279
-
280
-
281
-
282
-
283
-
284
-
285
-
286
-
287
-
288
-
289
-
290
-
291
-
292
-
293
-
294
-
295
-
296
-
297
-
298
-
299
-
300
-
301
-
302
-
303
-
304
-
305
-
306
-
307
-
308
-
309
-
310
-
311
-
312
-
313
-
314
-
315
-
316
-
317
-
318
-
319
-
320
-
321
-
322
-
323
-
324
-
325
-
326
-
327
-
328
-
329
-
330
-
331
-
332
-
333
-
334
-
335
-
336
-
337
-
338
-
339
-
340
-
341
-
342
-
343
-
344
-
345
-
346
-
347
-
348
-
349
-
350
-
351
 |
 |

Table of Contents
Comcast 2010 Annual Report on Form 10-K
76
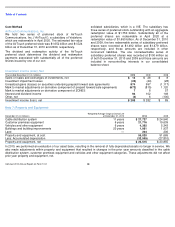
certain limits. In 2010, 2009 and 2008, expenses related to
these plans amounted to $152 million, $182 million and
$178 million, respectively.
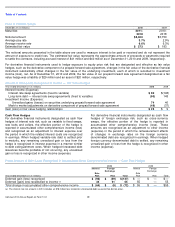
Severance Benefits
We provide certain former employees severance benefits that
are payable after employment. A liability is recorded for
benefits provided when payment is probable, the amount is
reasonably estimable, and the obligation relates to rights that
have vested or accumulated. We recorded $67 million,
$81 million and $126 million of severance costs during 2010,
2009 and 2008, respectively.
Note 14: Equity
Common Stock
In the aggregate, holders of our Class A common stock have
66 / % of the voting power of our common stock and
holders of our Class B common stock have 33 / % of the
voting power of our common stock. Our Class A Special
common stock is generally nonvoting. Each share of our
Class B common stock is entitled to 15 votes. The number of
votes held by each share of our Class A common stock
depends on the number of shares of Class A and Class B
common stock outstanding at any given time. The 33 / %
aggregate voting power of our Class B common stock cannot
be diluted by additional issuances of any other class of
common stock. Our Class B common stock is convertible,
share for share, into Class A or Class A Special common
stock, subject to certain restrictions.
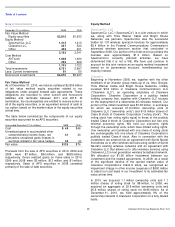
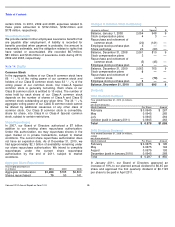
Share Repurchases
In 2007, our Board of Directors authorized a $7 billion
addition to our existing share repurchase authorization.
Under this authorization, we may repurchase shares in the
open market or in private transactions, subject to market
conditions. The current share repurchase authorization does
not have an expiration date. As of December 31, 2010, we
had approximately $2.1 billion of availability remaining under
our share repurchase authorization. We intend to complete
repurchases under the current share repurchase
authorization by the end of 2011, subject to market
conditions.
Aggregate Share Repurchases
Year ended December 31
(in millions)
2010
2009
2008
Aggregate consideration
$
1,200
$
765
$
2,800
Shares repurchased
70
50
141
2 3 1 3
1 3
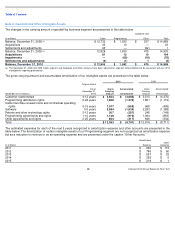
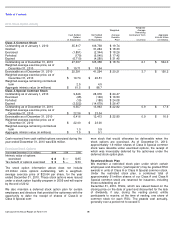
Changes in Common Stock Outstanding
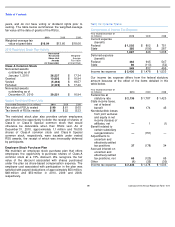
Dividends
2010 Dividends Declared
In January 2011, our Board of Directors approved an
increase of 19% to our planned annual dividend to $0.45 per
share and approved the first quarterly dividend of $0.1125
per share to be paid in April 2011.
(shares in millions)
A
A
Special
B
Balance, January 1, 2008
2,054
948
9
Stock compensation plans
4
3
—
Repurchase and retirement of
common stock
(20
)
(121
)
—
Employee stock purchase plan
3
—
—
Share exchange
20
(20
)
—
Balance, December 31, 2008
2,061
810
9
Stock compensation plans
3
—
—
Repurchase and retirement of
common stock
(5
)
(45
)
—
Employee stock purchase plan
4
—
—
Balance, December 31, 2009
2,063
765
9
Stock compensation plans
6
—
—
Repurchase and retirement of
common stock
—
(
70
)
—
Employee stock purchase plan
3
—
—
Balance, December 31, 2010
2,072
695
9
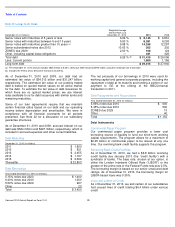
Year ended December 31, 2010 (in millions,
except
per share amounts)
Month Declared
Per Share
Amount
February
$
0.0945
$
267
May
0.0945
265
July
0.0945
264
October (paid in January 2011)
0.0945
263
Total
$
0.378
$
1,059
2009 Dividends Declared
Year ended December 31, 2009 (in millions,
except
per share amounts)
Month Declared
Per Share
Amount
February
$
0.0675
$
195
May
0.0675
194
August
0.0675
193
December (paid in January 2010)
0.0945
268
Total
$
0.297
$
850