Comcast 2010 Annual Report Download - page 7
Download and view the complete annual report
Please find page 7 of the 2010 Comcast annual report below. You can navigate through the pages in the report by either clicking on the pages listed below, or by using the keyword search tool below to find specific information within the annual report.-
 1
1 -
 2
2 -
 3
3 -
 4
4 -
 5
5 -
 6
6 -
 7
7 -
 8
8 -
 9
9 -
 10
10 -
 11
11 -
 12
12 -
 13
13 -
 14
14 -
 15
15 -
 16
16 -
 17
17 -
 18
18 -
19
-
20
-
21
-
22
-
23
-
24
-
25
-
26
-
27
-
28
-
29
-
30
-
31
-
32
-
33
-
34
-
35
-
36
-
37
-
38
-
39
-
40
-
41
-
42
-
43
-
44
-
45
-
46
-
47
-
48
-
49
-
50
-
51
-
52
-
53
-
54
-
55
-
56
-
57
-
58
-
59
-
60
-
61
-
62
-
63
-
64
-
65
-
66
-
67
-
68
-
69
-
70
-
71
-
72
-
73
-
74
-
75
-
76
-
77
-
78
-
79
-
80
-
81
-
82
-
83
-
84
-
85
-
86
-
87
-
88
-
89
-
90
-
91
-
92
-
93
-
94
-
95
-
96
-
97
-
98
-
99
-
100
-
101
-
102
-
103
-
104
-
105
-
106
-
107
-
108
-
109
-
110
-
111
-
112
-
113
-
114
-
115
-
116
-
117
-
118
-
119
-
120
-
121
-
122
-
123
-
124
-
125
-
126
-
127
-
128
-
129
-
130
-
131
-
132
-
133
-
134
-
135
-
136
-
137
-
138
-
139
-
140
-
141
-
142
-
143
-
144
-
145
-
146
-
147
-
148
-
149
-
150
-
151
-
152
-
153
-
154
-
155
-
156
-
157
-
158
-
159
-
160
-
161
-
162
-
163
-
164
-
165
-
166
-
167
-
168
-
169
-
170
-
171
-
172
-
173
-
174
-
175
-
176
-
177
-
178
-
179
-
180
-
181
-
182
-
183
-
184
-
185
-
186
-
187
-
188
-
189
-
190
-
191
-
192
-
193
-
194
-
195
-
196
-
197
-
198
-
199
-
200
-
201
-
202
-
203
-
204
-
205
-
206
-
207
-
208
-
209
-
210
-
211
-
212
-
213
-
214
-
215
-
216
-
217
-
218
-
219
-
220
-
221
-
222
-
223
-
224
-
225
-
226
-
227
-
228
-
229
-
230
-
231
-
232
-
233
-
234
-
235
-
236
-
237
-
238
-
239
-
240
-
241
-
242
-
243
-
244
-
245
-
246
-
247
-
248
-
249
-
250
-
251
-
252
-
253
-
254
-
255
-
256
-
257
-
258
-
259
-
260
-
261
-
262
-
263
-
264
-
265
-
266
-
267
-
268
-
269
-
270
-
271
-
272
-
273
-
274
-
275
-
276
-
277
-
278
-
279
-
280
-
281
-
282
-
283
-
284
-
285
-
286
-
287
-
288
-
289
-
290
-
291
-
292
-
293
-
294
-
295
-
296
-
297
-
298
-
299
-
300
-
301
-
302
-
303
-
304
-
305
-
306
-
307
-
308
-
309
-
310
-
311
-
312
-
313
-
314
-
315
-
316
-
317
-
318
-
319
-
320
-
321
-
322
-
323
-
324
-
325
-
326
-
327
-
328
-
329
-
330
-
331
-
332
-
333
-
334
-
335
-
336
-
337
-
338
-
339
-
340
-
341
-
342
-
343
-
344
-
345
-
346
-
347
-
348
-
349
-
350
-
351
 |
 |

Table of Contents
Description of Our Businesses
Cable Segment
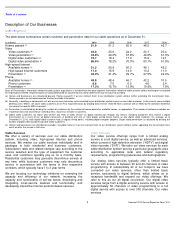
The table below summarizes certain customer and penetration data for our cable operations as of December 31.
Basis of Presentation: Information related to cable system acquisitions is included from the date acquired. Information related to cable systems sold or exchanged is excluded
for all periods presented. All percentages are calculated based on actual amounts. Minor differences may exist due to rounding.
(in millions)
2010
2009
2008
2007
2006
Homes passed
51.9
51.2
50.6
48.5
45.7
Video
Video customers
22.8
23.6
24.2
24.1
23.4
Video penetration
43.9
%
46.0
%
47.8
%
49.6
%
51.3
%
Digital video customers
19.7
18.4
17.0
15.2
12.1
Digital video penetration
86.6
%
78.2
%
70.3
%
63.1
%
51.9
%
High-speed Internet
Available homes
51.5
50.8
50.3
48.1
45.2
High
-
speed Internet customers
17.0
15.9
14.9
13.2
11.0
Penetration
33.0
%
31.4
%
29.7
%
27.5
%
24.4
%
Phone
Available homes
49.8
48.4
46.7
42.2
31.5
Phone customers
8.6
7.6
6.5
4.6
2.4
Penetration
17.3
%
15.7
%
13.9
%
10.8
%
7.6
%
(a)
Homes and businesses are considered passed (“homes passed”)
if we can connect them to our distribution system without further extending the transmission lines.
Homes passed is an estimate based on the best available information.
(b)
Generally, a dwelling or commercial unit with one or more television sets connected to our distribution system counts as one video customer. In the case of some multiple
dwelling units (“MDU”),
we count video customers on an FCC equivalent basis by dividing total revenue received from a contract with an MDU by the standard residential
rate where the specific MDU is located.
(c)
Penetration is calculated by dividing the number of customers by the number of homes passed or available homes, as appropriate. The number of customers includes our
residential and small and medium-sized business (“business services”) customers.
(d)
Digital video customers are those who receive any level of video service via digital transmission through any means, including customers who receive a digital
transmission as a result of our all digital conversion. A dwelling with one or more digital set-
top boxes counts as one digital video customer. On average, as of
December 31, 2010, each digital video customer had 2.5 digital set-
top boxes, including digital transport adapters. Digital video penetration is calculated by dividing the
number of digital video customers by total video customers.
(e)
Homes and businesses are considered available (“available homes”)
if we can connect them to our distribution system without further upgrading the transmission lines
and if we offer the service in that area.
3
Comcast 2010 Annual Report on Form 10-
K
(a)
(b)
(c)
(d)
(d)
(e)
(c)
(e)
(c)
Cable Services
We offer a variety of services over our cable distribution
system, including video, high-speed Internet and phone
services. We market our cable services individually and in
packages to both residential and business customers.
Subscription rates and related charges vary according to the
service selected and the type of equipment the customer
uses, and customers typically pay us on a monthly basis.
Residential customers may generally discontinue service at
any time, while business customers may only discontinue
service in accordance with the terms of their respective
contracts, which typically have 1 to 3 year terms.
We are focusing our technology initiatives on extending the
capacity and efficiency of our network, increasing the
capacity and functionality of set-top boxes, developing and
integrating cross-service features and functionality, and
developing interactive Internet protocol-based services.
Video Services
Our video service offerings range from a limited analog
service to a full digital service, as well as advanced services,
which consist of high
-definition television (“HDTV”) and digital
video recorder (“DVR”). We tailor our video services for each
cable distribution system serving a particular geographic area
according to applicable local and federal regulatory
requirements, programming preferences and demographics.
Our analog video services typically offer a limited basic
service with access to between 20 and 40 channels of video
programming. In substantially all of our footprint, we have
converted our video services, other than limited basic
service, exclusively to digital delivery, which allows us to
recapture bandwidth and expand our video offerings. We
refer to this as our all digital conversion. Our digital video
services range from a digital economy service with access to
approximately 50 channels of video programming to a full
digital service with access to over 300 channels. Our video
services