Comcast 2010 Annual Report Download - page 102
Download and view the complete annual report
Please find page 102 of the 2010 Comcast annual report below. You can navigate through the pages in the report by either clicking on the pages listed below, or by using the keyword search tool below to find specific information within the annual report.-
 1
1 -
2
-
3
-
4
-
5
-
6
-
7
-
8
-
9
-
10
-
11
-
12
-
13
-
14
-
15
-
16
-
17
-
18
-
19
-
20
-
21
-
22
-
23
-
24
-
25
-
26
-
27
-
28
-
29
-
30
-
31
-
32
-
33
-
34
-
35
-
36
-
37
-
38
-
39
-
40
-
41
-
42
-
43
-
44
-
45
-
46
-
47
-
48
-
49
-
50
-
51
-
52
-
53
-
54
-
55
-
56
-
57
-
58
-
59
-
60
-
61
-
62
-
63
-
64
-
65
-
66
-
67
-
68
-
69
-
70
-
71
-
72
-
73
-
74
-
75
-
76
-
77
-
78
-
79
-
80
-
81
-
82
-
83
-
84
-
85
-
86
-
87
-
88
-
89
-
90
-
91
-
 92
92 -
 93
93 -
 94
94 -
 95
95 -
 96
96 -
 97
97 -
 98
98 -
 99
99 -
 100
100 -
 101
101 -
 102
102 -
 103
103 -
 104
104 -
 105
105 -
 106
106 -
 107
107 -
 108
108 -
 109
109 -
 110
110 -
 111
111 -
 112
112 -
113
-
114
-
115
-
116
-
117
-
118
-
119
-
120
-
121
-
122
-
123
-
124
-
125
-
126
-
127
-
128
-
129
-
130
-
131
-
132
-
133
-
134
-
135
-
136
-
137
-
138
-
139
-
140
-
141
-
142
-
143
-
144
-
145
-
146
-
147
-
148
-
149
-
150
-
151
-
152
-
153
-
154
-
155
-
156
-
157
-
158
-
159
-
160
-
161
-
162
-
163
-
164
-
165
-
166
-
167
-
168
-
169
-
170
-
171
-
172
-
173
-
174
-
175
-
176
-
177
-
178
-
179
-
180
-
181
-
182
-
183
-
184
-
185
-
186
-
187
-
188
-
189
-
190
-
191
-
192
-
193
-
194
-
195
-
196
-
197
-
198
-
199
-
200
-
201
-
202
-
203
-
204
-
205
-
206
-
207
-
208
-
209
-
210
-
211
-
212
-
213
-
214
-
215
-
216
-
217
-
218
-
219
-
220
-
221
-
222
-
223
-
224
-
225
-
226
-
227
-
228
-
229
-
230
-
231
-
232
-
233
-
234
-
235
-
236
-
237
-
238
-
239
-
240
-
241
-
242
-
243
-
244
-
245
-
246
-
247
-
248
-
249
-
250
-
251
-
252
-
253
-
254
-
255
-
256
-
257
-
258
-
259
-
260
-
261
-
262
-
263
-
264
-
265
-
266
-
267
-
268
-
269
-
270
-
271
-
272
-
273
-
274
-
275
-
276
-
277
-
278
-
279
-
280
-
281
-
282
-
283
-
284
-
285
-
286
-
287
-
288
-
289
-
290
-
291
-
292
-
293
-
294
-
295
-
296
-
297
-
298
-
299
-
300
-
301
-
302
-
303
-
304
-
305
-
306
-
307
-
308
-
309
-
310
-
311
-
312
-
313
-
314
-
315
-
316
-
317
-
318
-
319
-
320
-
321
-
322
-
323
-
324
-
325
-
326
-
327
-
328
-
329
-
330
-
331
-
332
-
333
-
334
-
335
-
336
-
337
-
338
-
339
-
340
-
341
-
342
-
343
-
344
-
345
-
346
-
347
-
348
-
349
-
350
-
351
 |
 |

Table of Contents
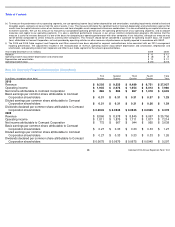
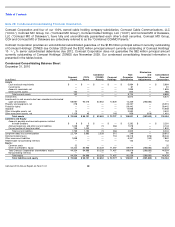
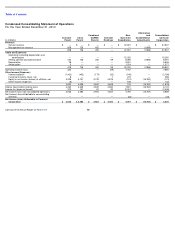
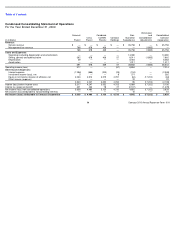
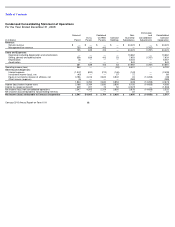
Condensed Consolidating Statement of Operations
For the Year Ended December 31, 2010
(in millions)
Comcast
Parent
CCCL
Parent
Combined
CCHMO
Parents
Comcast
Holdings
Non
-
Guarantor
Subsidiaries
Elimination
and
Consolidation
Adjustments
Consolidated
Comcast
Corporation
Revenue:
Service revenue
$
—
$
—
$ —
$
—
$
37,937
$ —
$
37,937
Management fee revenue
808
726
452
—
—
(
1,986
)
—
808
726
452
—
37,937
(1,986
)
37,937
Costs and Expenses:
Operating (excluding depreciation and
amortization)
—
—
—
—
15,250
—
15,250
Selling, general and administrative
444
726
452
59
8,396
(1,986
)
8,091
Depreciation
29
—
—
—
5,510
—
5,539
Amortization
3
—
—
—
1,074
—
1,077
476
726
452
59
30,230
(1,986
)
29,957
Operating income (loss)
332
—
—
(
59
)
7,707
—
7,980
Other Income (Expense):
Interest expense
(1,402
)
(402
)
(173
)
(33
)
(146
)
—
(
2,156
)
Investment income (loss), net
8
—
—
7
273
—
288
Equity in net income (losses) of affiliates, net
4,329
4,741
3,015
4,675
(141
)
(16,760
)
(141
)
Other income (expense)
(5
)
—
—
—
138
—
133
2,930
4,339
2,842
4,649
124
(16,760
)
(1,876
)
Income (loss) before income taxes
3,262
4,339
2,842
4,590
7,831
(16,760
)
6,104
Income tax (expense) benefit
373
141
61
30
(3,041
)
—
(
2,436
)
Net income (loss) from consolidated operations
3,635
4,480
2,903
4,620
4,790
(16,760
)
3,668
Net (income) loss attributable to noncontrolling
interests
—
—
—
—
(
33
)
—
(
33
)
Net income (loss) attributable to Comcast
Corporation
$
3,635
$
4,480
$
2,903
$
4,620
$
4,757
$
(16,760
)
$
3,635
Comcast 2010 Annual Report on Form 10-K
90