Comcast 2010 Annual Report Download - page 80
Download and view the complete annual report
Please find page 80 of the 2010 Comcast annual report below. You can navigate through the pages in the report by either clicking on the pages listed below, or by using the keyword search tool below to find specific information within the annual report.-
 1
1 -
2
-
3
-
4
-
5
-
6
-
7
-
8
-
9
-
10
-
11
-
12
-
13
-
14
-
15
-
16
-
17
-
18
-
19
-
20
-
21
-
22
-
23
-
24
-
25
-
26
-
27
-
28
-
29
-
30
-
31
-
32
-
33
-
34
-
35
-
36
-
37
-
38
-
39
-
40
-
41
-
42
-
43
-
44
-
45
-
46
-
47
-
48
-
49
-
50
-
51
-
52
-
53
-
54
-
55
-
56
-
57
-
58
-
59
-
60
-
61
-
62
-
63
-
64
-
65
-
66
-
67
-
68
-
69
-
 70
70 -
 71
71 -
 72
72 -
 73
73 -
 74
74 -
 75
75 -
 76
76 -
 77
77 -
 78
78 -
 79
79 -
 80
80 -
 81
81 -
 82
82 -
 83
83 -
 84
84 -
 85
85 -
 86
86 -
 87
87 -
 88
88 -
 89
89 -
 90
90 -
91
-
92
-
93
-
94
-
95
-
96
-
97
-
98
-
99
-
100
-
101
-
102
-
103
-
104
-
105
-
106
-
107
-
108
-
109
-
110
-
111
-
112
-
113
-
114
-
115
-
116
-
117
-
118
-
119
-
120
-
121
-
122
-
123
-
124
-
125
-
126
-
127
-
128
-
129
-
130
-
131
-
132
-
133
-
134
-
135
-
136
-
137
-
138
-
139
-
140
-
141
-
142
-
143
-
144
-
145
-
146
-
147
-
148
-
149
-
150
-
151
-
152
-
153
-
154
-
155
-
156
-
157
-
158
-
159
-
160
-
161
-
162
-
163
-
164
-
165
-
166
-
167
-
168
-
169
-
170
-
171
-
172
-
173
-
174
-
175
-
176
-
177
-
178
-
179
-
180
-
181
-
182
-
183
-
184
-
185
-
186
-
187
-
188
-
189
-
190
-
191
-
192
-
193
-
194
-
195
-
196
-
197
-
198
-
199
-
200
-
201
-
202
-
203
-
204
-
205
-
206
-
207
-
208
-
209
-
210
-
211
-
212
-
213
-
214
-
215
-
216
-
217
-
218
-
219
-
220
-
221
-
222
-
223
-
224
-
225
-
226
-
227
-
228
-
229
-
230
-
231
-
232
-
233
-
234
-
235
-
236
-
237
-
238
-
239
-
240
-
241
-
242
-
243
-
244
-
245
-
246
-
247
-
248
-
249
-
250
-
251
-
252
-
253
-
254
-
255
-
256
-
257
-
258
-
259
-
260
-
261
-
262
-
263
-
264
-
265
-
266
-
267
-
268
-
269
-
270
-
271
-
272
-
273
-
274
-
275
-
276
-
277
-
278
-
279
-
280
-
281
-
282
-
283
-
284
-
285
-
286
-
287
-
288
-
289
-
290
-
291
-
292
-
293
-
294
-
295
-
296
-
297
-
298
-
299
-
300
-
301
-
302
-
303
-
304
-
305
-
306
-
307
-
308
-
309
-
310
-
311
-
312
-
313
-
314
-
315
-
316
-
317
-
318
-
319
-
320
-
321
-
322
-
323
-
324
-
325
-
326
-
327
-
328
-
329
-
330
-
331
-
332
-
333
-
334
-
335
-
336
-
337
-
338
-
339
-
340
-
341
-
342
-
343
-
344
-
345
-
346
-
347
-
348
-
349
-
350
-
351
 |
 |

Table of Contents
facilities and unused irrevocable standby letters of credit
totaling $431 million to cover potential fundings under various
agreements .
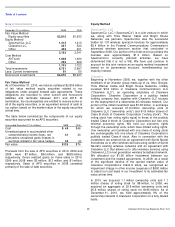
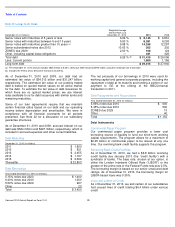
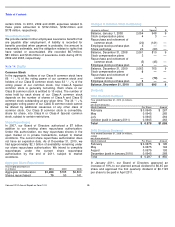
ZONES
At maturity, holders of our 2.0% Exchangeable Subordinated
Debentures due 2029 (“ZONES”) are entitled to receive in
cash an amount equal to the higher of the principal amount of
the outstanding ZONES of $247 million or the market value of
approximately 3.3 million shares of Sprint Nextel common
stock and 228,807 shares of CenturyLink common stock.
Before maturity, each of the ZONES is exchangeable at the
holder’s option for an amount of cash equal to 95% of the
aggregate market value of one share of Sprint Nextel
common stock and 0.0685 shares of CenturyLink common
stock.
We separate the accounting for the ZONES into derivative
and debt components. The following table presents the
change in the carrying value of the debt component and the
change in the fair value of the derivative component (see
Note 6).
Note 10: Derivative Financial Instruments
We use derivative financial instruments to manage our
exposure to the risks associated with fluctuations in interest
rates, equity prices and foreign exchange rates.
We manage our exposure to fluctuations in interest rates by
using derivative financial instruments such as interest rate
exchange agreements (“swaps”), interest rate lock
agreements (“rate locks”) and interest rate collars (“collars”).
We sometimes enter into rate locks or collars to hedge the
risk that the cash flows related to the interest payments on an
anticipated issuance or assumption of fixed-rate debt may be
adversely affected by interest rate fluctuations.
We manage our exposure to and benefits from price
fluctuations in the common stock of some of our investments
by using equity derivative financial instruments embedded in
other contracts, such as prepaid forward sale agreements,
(in millions)
Debt
Component
Derivative
Component
Total
Balance,
January 1,
2010
$
109
$
15
$
124
Change in debt
component to
interest
expense
5
—
5
Change in
derivative
component to
investment
income (loss),
net
—
(
5
)
(5
)
Repurchases
(14
)
(2
)
(16
)
Balance,
December 31,
2010
$
100
$
8
$
108
We manage our exposure to foreign exchange risk related to
our foreign currency denominated borrowings by using cross-
currency swaps, effectively converting these borrowings to
U.S. dollar denominated borrowings.
We manage the credit risks associated with our derivative
financial instruments through diversification and the
evaluation and monitoring of the creditworthiness of the
counterparties. Although we may be exposed to losses in the
event of nonperformance by the counterparties, we do not
expect such losses, if any, to be significant. We have
agreements with certain counterparties that include collateral
provisions. These provisions require a party with an
aggregate unrealized loss position in excess of certain
thresholds to post cash collateral for the amount in excess of
the threshold. The threshold levels in our collateral
agreements are based on our and the counterparties’ credit
ratings. As of December 31, 2010, neither we nor any of the
counterparties were required to post collateral under the
terms of the agreements.
As of December 31, 2010, our derivative financial
instruments designated as hedges included (i) the derivative
component of one of our prepaid forward sale agreements,
which is recorded to other noncurrent liabilities, (ii) our
interest rate swap agreements, which are recorded to other
current or noncurrent assets, and (iii) our cross-currency
swaps, which are recorded to other noncurrent liabilities. As
of December 31, 2010, our derivative financial instruments
not designated as hedges were (i) the derivative component
of our indexed debt instruments (our ZONES debt), which is
recorded to long-term debt, and (ii) the derivative component
of certain of our prepaid forward sale agreements, which is
recorded to other current and noncurrent liabilities. See Note
11 for further details on the fair values of our derivative
financial instruments as of December 31, 2010 and 2009.
Fair Value Hedges
For derivative financial instruments used to hedge exposure
to interest rate risk that are designated and effective as fair
value hedges, such as fixed to variable swaps, changes in
the fair value of the derivative financial instrument
substantially offset changes in the fair value of the underlying
debt, each of which is recorded to interest expense.
Using swaps, we agree to exchange, at specified dates, the
difference between fixed and variable interest amounts
calculated by reference to an agreed-upon notional principal
amount. In the ordinary course of business, some of our
swaps could be subject to termination provisions if we do not
maintain investment grade credit ratings. The amount to be
paid or received upon termination, if any, would be based on
the fair value of the outstanding contracts at that time. As of
both December 31, 2010 and 2009, the estimated fair value
of those swaps was an asset of $26 million. The table below
summarizes the terms of our existing swaps.