Comcast 2010 Annual Report Download - page 84
Download and view the complete annual report
Please find page 84 of the 2010 Comcast annual report below. You can navigate through the pages in the report by either clicking on the pages listed below, or by using the keyword search tool below to find specific information within the annual report.-
 1
1 -
2
-
3
-
4
-
5
-
6
-
7
-
8
-
9
-
10
-
11
-
12
-
13
-
14
-
15
-
16
-
17
-
18
-
19
-
20
-
21
-
22
-
23
-
24
-
25
-
26
-
27
-
28
-
29
-
30
-
31
-
32
-
33
-
34
-
35
-
36
-
37
-
38
-
39
-
40
-
41
-
42
-
43
-
44
-
45
-
46
-
47
-
48
-
49
-
50
-
51
-
52
-
53
-
54
-
55
-
56
-
57
-
58
-
59
-
60
-
61
-
62
-
63
-
64
-
65
-
66
-
67
-
68
-
69
-
70
-
71
-
72
-
73
-
 74
74 -
 75
75 -
 76
76 -
 77
77 -
 78
78 -
 79
79 -
 80
80 -
 81
81 -
 82
82 -
 83
83 -
 84
84 -
 85
85 -
 86
86 -
 87
87 -
 88
88 -
 89
89 -
 90
90 -
 91
91 -
 92
92 -
 93
93 -
 94
94 -
95
-
96
-
97
-
98
-
99
-
100
-
101
-
102
-
103
-
104
-
105
-
106
-
107
-
108
-
109
-
110
-
111
-
112
-
113
-
114
-
115
-
116
-
117
-
118
-
119
-
120
-
121
-
122
-
123
-
124
-
125
-
126
-
127
-
128
-
129
-
130
-
131
-
132
-
133
-
134
-
135
-
136
-
137
-
138
-
139
-
140
-
141
-
142
-
143
-
144
-
145
-
146
-
147
-
148
-
149
-
150
-
151
-
152
-
153
-
154
-
155
-
156
-
157
-
158
-
159
-
160
-
161
-
162
-
163
-
164
-
165
-
166
-
167
-
168
-
169
-
170
-
171
-
172
-
173
-
174
-
175
-
176
-
177
-
178
-
179
-
180
-
181
-
182
-
183
-
184
-
185
-
186
-
187
-
188
-
189
-
190
-
191
-
192
-
193
-
194
-
195
-
196
-
197
-
198
-
199
-
200
-
201
-
202
-
203
-
204
-
205
-
206
-
207
-
208
-
209
-
210
-
211
-
212
-
213
-
214
-
215
-
216
-
217
-
218
-
219
-
220
-
221
-
222
-
223
-
224
-
225
-
226
-
227
-
228
-
229
-
230
-
231
-
232
-
233
-
234
-
235
-
236
-
237
-
238
-
239
-
240
-
241
-
242
-
243
-
244
-
245
-
246
-
247
-
248
-
249
-
250
-
251
-
252
-
253
-
254
-
255
-
256
-
257
-
258
-
259
-
260
-
261
-
262
-
263
-
264
-
265
-
266
-
267
-
268
-
269
-
270
-
271
-
272
-
273
-
274
-
275
-
276
-
277
-
278
-
279
-
280
-
281
-
282
-
283
-
284
-
285
-
286
-
287
-
288
-
289
-
290
-
291
-
292
-
293
-
294
-
295
-
296
-
297
-
298
-
299
-
300
-
301
-
302
-
303
-
304
-
305
-
306
-
307
-
308
-
309
-
310
-
311
-
312
-
313
-
314
-
315
-
316
-
317
-
318
-
319
-
320
-
321
-
322
-
323
-
324
-
325
-
326
-
327
-
328
-
329
-
330
-
331
-
332
-
333
-
334
-
335
-
336
-
337
-
338
-
339
-
340
-
341
-
342
-
343
-
344
-
345
-
346
-
347
-
348
-
349
-
350
-
351
 |
 |

Table of Contents
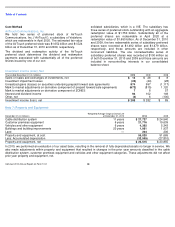
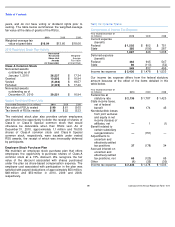
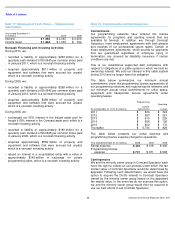
Recurring Fair Value Measures
The table below presents the changes in equity resulting from net income attributable to Comcast Corporation and transfers to or
from noncontrolling interests.
Fair Value as of December 31, 2010
Fair Value as of December 31, 2009
(in millions)
Level 1
Level 2
Level 3
Total
Level 1
Level 2
Level 3
Total
Assets
Trading securities
$
2,688
$
—
$
—
$
2,688
$
1,855
$
—
$ —
$
1,855
Available
-for-sale securities
126
—
—
126
76
—
—
76
Equity warrants
—
—
1
1
—
—
2
2
Interest rate swap agreements
—
232
—
232
—
143
—
143
$
2,814
$
232
$
1
$
3,047
$
1,931
$
143
$
2
$
2,076
Liabilities
Derivative component of ZONES
$
—
$
8
$
—
$
8
$
—
$
15
$ —
$
15
Derivative component of prepaid forward sale
agreements
—
1,021
—
1,021
—
349
—
349
Interest rate swap agreements
—
—
—
—
—
1
—
1
Cross-currency swaps
—
29
—
29
—
—
—
—
$
—
$
1,058
$
—
$
1,058
$
—
$
365
$ —
$
365
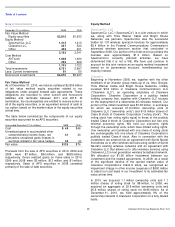
Year ended December 31 (in millions)
2010
2009
Net income attributable to Comcast Corporation
$
3,635
$
3,638
Transfers from (to) noncontrolling interests:
Increase in Comcast Corporation additional paid-in capital resulting from the purchase of noncontrolling
interest
11
30
Decrease in Comcast Corporation additional paid-in capital resulting from the purchase of
noncontrolling interest
—
(
69
)
Changes from net income attributable to Comcast Corporation and transfers from (to) noncontrolling
interests
$
3,646
$
3,599
Comcast 2010 Annual Report on Form 10-K
74
We have assets and liabilities required to be recorded at fair
value on a nonrecurring basis when certain circumstances
occur. In 2010, we recorded impairment charges to goodwill
of $76 million representing the amount of excess of the
reporting unit carrying amount of goodwill over its implied fair
value, which was determined using Level 3 measures.
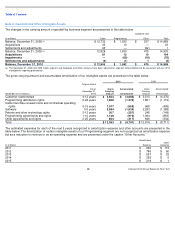
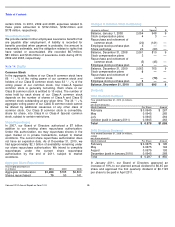
Note 12: Noncontrolling Interests
Certain of our subsidiaries that we consolidate are not wholly
owned. Some of the agreements with the minority partners of
these subsidiaries contain redemption features whereby
interests held by the minority partners are redeemable either
(i) at the option of the holder or (ii) upon the occurrence of an
event that is not solely within our control. If interests were to
be redeemed under these agreements, we would generally
be required to purchase the interest at fair value on the date
of redemption. These interests are presented on the balance
sheet outside of equity under the caption “Redeemable
noncontrolling interests.” Noncontrolling interests that do not
contain such redemption features are presented in equity.
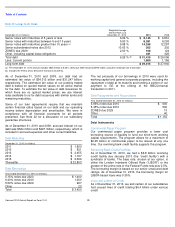
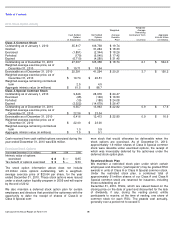
In 2010, we acquired all of the noncontrolling interest of one
of our technology ventures, which had a carrying value of
approximately $20 million, for approximately $9 million. The
difference between the amount paid and the carrying value
resulted in an increase of approximately $11 million to
additional paid-in capital of Comcast Corporation.
In 2009, we acquired all of the noncontrolling interest of one
of our technology ventures, which had a carrying value of
approximately $35 million, for approximately $5 million and
rights to existing intellectual property. The difference between
the amount paid and the carrying value resulted in an
increase of approximately $30 million to additional paid-in
capital of Comcast Corporation.
Also in 2009, through a series of transactions, we acquired all
of the noncontrolling interest of one of our regional sports
networks, which had a carrying value of approximately
$4 million, for approximately $73 million. The difference
between the amount paid and the carrying value resulted in a
decrease of approximately $69 million to additional paid-in
capital of Comcast Corporation.