Comcast 2010 Annual Report Download - page 79
Download and view the complete annual report
Please find page 79 of the 2010 Comcast annual report below. You can navigate through the pages in the report by either clicking on the pages listed below, or by using the keyword search tool below to find specific information within the annual report.-
 1
1 -
 2
2 -
 3
3 -
 4
4 -
 5
5 -
 6
6 -
 7
7 -
 8
8 -
 9
9 -
 10
10 -
 11
11 -
 12
12 -
 13
13 -
 14
14 -
 15
15 -
 16
16 -
 17
17 -
 18
18 -
 19
19 -
 20
20 -
 21
21 -
 22
22 -
 23
23 -
 24
24 -
 25
25 -
 26
26 -
 27
27 -
 28
28 -
 29
29 -
 30
30 -
 31
31 -
 32
32 -
 33
33 -
 34
34 -
 35
35 -
 36
36 -
 37
37 -
 38
38 -
 39
39 -
 40
40 -
 41
41 -
 42
42 -
 43
43 -
 44
44 -
 45
45 -
 46
46 -
 47
47 -
 48
48 -
 49
49 -
 50
50 -
 51
51 -
 52
52 -
 53
53 -
 54
54 -
 55
55 -
 56
56 -
 57
57 -
 58
58 -
 59
59 -
 60
60 -
 61
61 -
 62
62 -
 63
63 -
 64
64 -
 65
65 -
 66
66 -
 67
67 -
 68
68 -
 69
69 -
 70
70 -
 71
71 -
 72
72 -
 73
73 -
 74
74 -
 75
75 -
 76
76 -
 77
77 -
 78
78 -
 79
79 -
 80
80 -
 81
81 -
 82
82 -
 83
83 -
 84
84 -
 85
85 -
 86
86 -
 87
87 -
 88
88 -
 89
89 -
 90
90 -
 91
91 -
 92
92 -
 93
93 -
 94
94 -
 95
95 -
 96
96 -
 97
97 -
 98
98 -
 99
99 -
 100
100 -
 101
101 -
 102
102 -
 103
103 -
 104
104 -
 105
105 -
 106
106 -
 107
107 -
 108
108 -
 109
109 -
 110
110 -
 111
111 -
 112
112 -
 113
113 -
 114
114 -
 115
115 -
 116
116 -
 117
117 -
 118
118 -
 119
119 -
 120
120 -
 121
121 -
 122
122 -
 123
123 -
 124
124 -
 125
125 -
 126
126 -
 127
127 -
 128
128 -
 129
129 -
 130
130 -
 131
131 -
 132
132 -
 133
133 -
 134
134 -
 135
135 -
 136
136 -
 137
137 -
 138
138 -
 139
139 -
 140
140 -
 141
141 -
 142
142 -
 143
143 -
 144
144 -
 145
145 -
 146
146 -
 147
147 -
 148
148 -
 149
149 -
 150
150 -
 151
151 -
 152
152 -
 153
153 -
 154
154 -
 155
155 -
 156
156 -
 157
157 -
 158
158 -
 159
159 -
 160
160 -
 161
161 -
 162
162 -
 163
163 -
 164
164 -
 165
165 -
 166
166 -
 167
167 -
 168
168 -
 169
169 -
 170
170 -
 171
171 -
 172
172 -
 173
173 -
 174
174 -
 175
175 -
 176
176 -
 177
177 -
 178
178 -
 179
179 -
 180
180 -
 181
181 -
 182
182 -
 183
183 -
 184
184 -
 185
185 -
 186
186 -
 187
187 -
 188
188 -
 189
189 -
 190
190 -
 191
191 -
 192
192 -
 193
193 -
 194
194 -
 195
195 -
 196
196 -
 197
197 -
 198
198 -
 199
199 -
 200
200 -
 201
201 -
 202
202 -
 203
203 -
 204
204 -
 205
205 -
 206
206 -
 207
207 -
 208
208 -
 209
209 -
 210
210 -
 211
211 -
 212
212 -
 213
213 -
 214
214 -
 215
215 -
 216
216 -
 217
217 -
 218
218 -
 219
219 -
 220
220 -
 221
221 -
 222
222 -
 223
223 -
 224
224 -
 225
225 -
 226
226 -
 227
227 -
 228
228 -
 229
229 -
 230
230 -
 231
231 -
 232
232 -
 233
233 -
 234
234 -
 235
235 -
 236
236 -
 237
237 -
 238
238 -
 239
239 -
 240
240 -
 241
241 -
 242
242 -
 243
243 -
 244
244 -
 245
245 -
 246
246 -
 247
247 -
 248
248 -
 249
249 -
 250
250 -
 251
251 -
 252
252 -
 253
253 -
 254
254 -
 255
255 -
 256
256 -
 257
257 -
 258
258 -
 259
259 -
 260
260 -
 261
261 -
 262
262 -
 263
263 -
 264
264 -
 265
265 -
 266
266 -
 267
267 -
 268
268 -
 269
269 -
 270
270 -
 271
271 -
 272
272 -
 273
273 -
 274
274 -
 275
275 -
 276
276 -
 277
277 -
 278
278 -
 279
279 -
 280
280 -
 281
281 -
 282
282 -
 283
283 -
 284
284 -
 285
285 -
 286
286 -
 287
287 -
 288
288 -
 289
289 -
 290
290 -
 291
291 -
 292
292 -
 293
293 -
 294
294 -
 295
295 -
 296
296 -
 297
297 -
 298
298 -
 299
299 -
 300
300 -
 301
301 -
 302
302 -
 303
303 -
 304
304 -
 305
305 -
 306
306 -
 307
307 -
 308
308 -
 309
309 -
 310
310 -
 311
311 -
 312
312 -
 313
313 -
 314
314 -
 315
315 -
 316
316 -
 317
317 -
 318
318 -
 319
319 -
 320
320 -
 321
321 -
 322
322 -
 323
323 -
 324
324 -
 325
325 -
 326
326 -
 327
327 -
 328
328 -
 329
329 -
 330
330 -
 331
331 -
 332
332 -
 333
333 -
 334
334 -
 335
335 -
 336
336 -
 337
337 -
 338
338 -
 339
339 -
 340
340 -
 341
341 -
 342
342 -
 343
343 -
 344
344 -
 345
345 -
 346
346 -
 347
347 -
 348
348 -
 349
349 -
 350
350 -
 351
351
 |
 |

Table of Contents
Note 9: Long-Term Debt
December 31 (in millions)
Weighted Average
Interest Rate as of
December 31, 2010
2010
2009
Senior notes with maturities of 5 years or less
6.96
%
$
8,145
$
6,861
Senior notes with maturities between 6 and 10 years
5.90
%
8,381
9,293
Senior notes with maturities greater than 10 years
6.88
%
14,258
12,287
Senior subordinated notes due 2012
10.63
%
202
202
ZONES due 2029
2.00
%
108
124
Other, including capital lease obligations
—
321
329
Total debt
6.26
%
$
31,415
$
29,096
Less: Current portion
1,800
1,156
Long-term debt
$
29,615
$
27,940
(a)
The December 31, 2010 amount includes £625 million of 5.50% notes due 2029 valued at $976 million using the exchange rate at that date.
(b)
Includes the effects of our derivative financial instruments.
Comcast 2010 Annual Report on Form 10-K
70
(a)
(b)
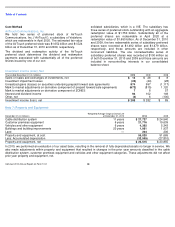
As of December 31, 2010 and 2009, our debt had an
estimated fair value of $34.312 billion and $31.247 billion,
respectively. The estimated fair value of our publicly traded
debt is based on quoted market values on an active market
for the debt. To estimate the fair value of debt issuances for
which there are no quoted market prices, we use interest
rates available to us for debt issuances with similar terms and
remaining maturities.
Some of our loan agreements require that we maintain
certain financial ratios based on our debt and our operating
income before depreciation and amortization. We were in
compliance with all financial covenants for all periods
presented. See Note 22 for a discussion of our subsidiary
guarantee structures.
As of December 31, 2010 and 2009, accrued interest on our
debt was $524 million and $497 million, respectively, which is
included in accrued expenses and other current liabilities.
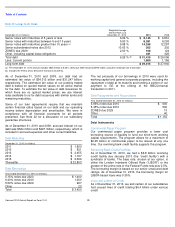
Debt Maturities
Debt Borrowings
December 31, 2010 (in millions)
2011
$
1,800
2012
$
821
2013
$
2,455
2014
$
1,167
2015
$
2,369
Thereafter
$
22,803
Year ended December 31, 2010 (in millions)
5.15% notes due 2020
$
1,400
6.40% notes due 2040
1,000
5.50% notes due 2029
997
Other
23
Total
$
3,420
The net proceeds of our borrowings in 2010 were used for
working capital and general corporate purposes, including the
repayment of debt at its maturity and funding a portion of our
payment to GE at the closing of the NBCUniversal
transaction in 2011.
Debt Repayments and Repurchases
Debt Instruments
Commercial Paper Program
Our commercial paper program provides a lower cost
borrowing source of liquidity to fund our short-term working
capital requirements. The program allows for a maximum of
$2.25 billion of commercial paper to be issued at any one
time. Our revolving bank credit facility supports this program.
Revolving Bank Credit Facilities
As of December 31, 2010, we had a $6.8 billion revolving
credit facility due January 2013 (the “credit facility”) with a
syndicate of banks. The base rate, chosen at our option, is
either the London Interbank Offered Rate (“LIBOR”) or the
greater of the prime rate or the Federal Funds rate plus 0.5%.
The borrowing margin is based on our senior unsecured debt
ratings. As of December 31, 2010, the borrowing margin for
LIBOR-based loans was 0.35%.
Lines and Letters of Credit
As of December 31, 2010, we and certain of our subsidiaries
had unused lines of credit totaling $6.4 billion under various
credit
Year ended December 31, 2010 (in millions)
5.85% notes due 2010
$
600
5.45% notes due 2010
500
ZONES due 2029
13
Other
40
Total
$
1,153
