Comcast 2010 Annual Report Download - page 44
Download and view the complete annual report
Please find page 44 of the 2010 Comcast annual report below. You can navigate through the pages in the report by either clicking on the pages listed below, or by using the keyword search tool below to find specific information within the annual report.-
 1
1 -
2
-
3
-
4
-
5
-
6
-
7
-
8
-
9
-
10
-
11
-
12
-
13
-
14
-
15
-
16
-
17
-
18
-
19
-
20
-
21
-
22
-
23
-
24
-
25
-
26
-
27
-
28
-
29
-
30
-
31
-
32
-
33
-
 34
34 -
 35
35 -
 36
36 -
 37
37 -
 38
38 -
 39
39 -
 40
40 -
 41
41 -
 42
42 -
 43
43 -
 44
44 -
 45
45 -
 46
46 -
 47
47 -
 48
48 -
 49
49 -
 50
50 -
 51
51 -
 52
52 -
 53
53 -
 54
54 -
55
-
56
-
57
-
58
-
59
-
60
-
61
-
62
-
63
-
64
-
65
-
66
-
67
-
68
-
69
-
70
-
71
-
72
-
73
-
74
-
75
-
76
-
77
-
78
-
79
-
80
-
81
-
82
-
83
-
84
-
85
-
86
-
87
-
88
-
89
-
90
-
91
-
92
-
93
-
94
-
95
-
96
-
97
-
98
-
99
-
100
-
101
-
102
-
103
-
104
-
105
-
106
-
107
-
108
-
109
-
110
-
111
-
112
-
113
-
114
-
115
-
116
-
117
-
118
-
119
-
120
-
121
-
122
-
123
-
124
-
125
-
126
-
127
-
128
-
129
-
130
-
131
-
132
-
133
-
134
-
135
-
136
-
137
-
138
-
139
-
140
-
141
-
142
-
143
-
144
-
145
-
146
-
147
-
148
-
149
-
150
-
151
-
152
-
153
-
154
-
155
-
156
-
157
-
158
-
159
-
160
-
161
-
162
-
163
-
164
-
165
-
166
-
167
-
168
-
169
-
170
-
171
-
172
-
173
-
174
-
175
-
176
-
177
-
178
-
179
-
180
-
181
-
182
-
183
-
184
-
185
-
186
-
187
-
188
-
189
-
190
-
191
-
192
-
193
-
194
-
195
-
196
-
197
-
198
-
199
-
200
-
201
-
202
-
203
-
204
-
205
-
206
-
207
-
208
-
209
-
210
-
211
-
212
-
213
-
214
-
215
-
216
-
217
-
218
-
219
-
220
-
221
-
222
-
223
-
224
-
225
-
226
-
227
-
228
-
229
-
230
-
231
-
232
-
233
-
234
-
235
-
236
-
237
-
238
-
239
-
240
-
241
-
242
-
243
-
244
-
245
-
246
-
247
-
248
-
249
-
250
-
251
-
252
-
253
-
254
-
255
-
256
-
257
-
258
-
259
-
260
-
261
-
262
-
263
-
264
-
265
-
266
-
267
-
268
-
269
-
270
-
271
-
272
-
273
-
274
-
275
-
276
-
277
-
278
-
279
-
280
-
281
-
282
-
283
-
284
-
285
-
286
-
287
-
288
-
289
-
290
-
291
-
292
-
293
-
294
-
295
-
296
-
297
-
298
-
299
-
300
-
301
-
302
-
303
-
304
-
305
-
306
-
307
-
308
-
309
-
310
-
311
-
312
-
313
-
314
-
315
-
316
-
317
-
318
-
319
-
320
-
321
-
322
-
323
-
324
-
325
-
326
-
327
-
328
-
329
-
330
-
331
-
332
-
333
-
334
-
335
-
336
-
337
-
338
-
339
-
340
-
341
-
342
-
343
-
344
-
345
-
346
-
347
-
348
-
349
-
350
-
351
 |
 |

Table of Contents
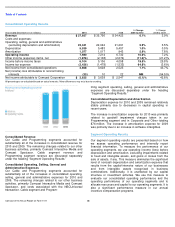
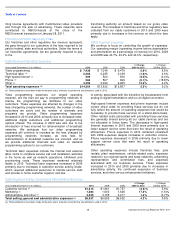
Consolidated Operating Results
All percentages are calculated based on actual amounts. Minor differences may exist due to rounding.
Year ended December 31 (in millions)
2010
2009
2008
% Change
2009 to 2010
% Change
2008 to 2009
Revenue
$
37,937
$
35,756
$
34,423
6.1
%
3.9
%
Costs and expenses:
Operating, selling, general and administrative
(excluding depreciation and amortization)
23,341
22,042
21,291
5.9
%
3.5
%
Depreciation
5,539
5,483
5,457
1.0
%
0.5
%
Amortization
1,077
1,017
943
5.9
%
7.8
%
Operating income
7,980
7,214
6,732
10.6
%
7.2
%
Other income (expense) items, net
(1,876
)
(2,108
)
(2,674
)
(11.0
)%
(21.2
)%
Income before income taxes
6,104
5,106
4,058
19.5
%
25.8
%
Income tax expense
(2,436
)
(1,478
)
(1,533
)
64.8
%
(3.6
)%
Net income from consolidated operations
3,668
3,628
2,525
1.1
%
43.7
%
Net (income) loss attributable to noncontrolling
interests
(33
)
10
22
NM
(54.5
)%
Net income attributable to Comcast Corporation
$
3,635
$
3,638
$
2,547
(0.1
)%
42.8
%
Comcast 2010 Annual Report on Form 10-K
38
Consolidated Revenue
Our Cable and Programming segments accounted for
substantially all of the increases in consolidated revenue for
2010 and 2009. The remaining changes related to our other
business activities, primarily Comcast Interactive Media and
Comcast Spectacor. Cable segment revenue and
Programming segment revenue are discussed separately
under the heading “Segment Operating Results.”
Consolidated Operating, Selling, General and
Administrative Expenses
Our Cable and Programming segments accounted for
substantially all of the increases in consolidated operating,
selling, general and administrative expenses for 2010 and
2009. The remaining changes related to our other business
activities, primarily Comcast Interactive Media and Comcast
Spectacor, and costs associated with the NBCUniversal
transaction. Cable segment and Program-
ming segment operating, selling, general and administrative
expenses are discussed separately under the heading
“Segment Operating Results.”
Consolidated Depreciation and Amortization
Depreciation expense for 2010 and 2009 remained relatively
stable primarily due to decreases in capital spending in
recent years.
The increase in amortization expense for 2010 was primarily
related to goodwill impairment charges taken in our
Programming segment and in Corporate and Other totaling
$76 million. The increase in amortization expense for 2009
was primarily due to an increase in software intangibles.
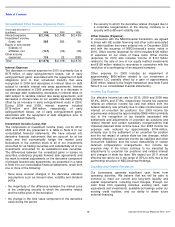
Segment Operating Results
Our segment operating results are presented based on how
we assess operating performance and internally report
financial information. To measure the performance of our
operating segments, we use operating income (loss) before
depreciation and amortization, excluding impairments related
to fixed and intangible assets, and gains or losses from the
sale of assets, if any. This measure eliminates the significant
level of noncash depreciation and amortization expense that
results from the capital-intensive nature of our businesses
and from intangible assets recognized in business
combinations. Additionally, it is unaffected by our capital
structure or investment activities. We use this measure to
evaluate our consolidated operating performance and the
operating performance of our operating segments and to
allocate resources and capital to our operating segments. It is
also a significant performance measure in our annual
incentive compensation programs.