Comcast 2010 Annual Report Download - page 46
Download and view the complete annual report
Please find page 46 of the 2010 Comcast annual report below. You can navigate through the pages in the report by either clicking on the pages listed below, or by using the keyword search tool below to find specific information within the annual report.-
 1
1 -
2
-
3
-
4
-
5
-
6
-
7
-
8
-
9
-
10
-
11
-
12
-
13
-
14
-
15
-
16
-
17
-
18
-
19
-
20
-
21
-
22
-
23
-
24
-
25
-
26
-
27
-
28
-
29
-
30
-
31
-
32
-
33
-
34
-
35
-
 36
36 -
 37
37 -
 38
38 -
 39
39 -
 40
40 -
 41
41 -
 42
42 -
 43
43 -
 44
44 -
 45
45 -
 46
46 -
 47
47 -
 48
48 -
 49
49 -
 50
50 -
 51
51 -
 52
52 -
 53
53 -
 54
54 -
 55
55 -
 56
56 -
57
-
58
-
59
-
60
-
61
-
62
-
63
-
64
-
65
-
66
-
67
-
68
-
69
-
70
-
71
-
72
-
73
-
74
-
75
-
76
-
77
-
78
-
79
-
80
-
81
-
82
-
83
-
84
-
85
-
86
-
87
-
88
-
89
-
90
-
91
-
92
-
93
-
94
-
95
-
96
-
97
-
98
-
99
-
100
-
101
-
102
-
103
-
104
-
105
-
106
-
107
-
108
-
109
-
110
-
111
-
112
-
113
-
114
-
115
-
116
-
117
-
118
-
119
-
120
-
121
-
122
-
123
-
124
-
125
-
126
-
127
-
128
-
129
-
130
-
131
-
132
-
133
-
134
-
135
-
136
-
137
-
138
-
139
-
140
-
141
-
142
-
143
-
144
-
145
-
146
-
147
-
148
-
149
-
150
-
151
-
152
-
153
-
154
-
155
-
156
-
157
-
158
-
159
-
160
-
161
-
162
-
163
-
164
-
165
-
166
-
167
-
168
-
169
-
170
-
171
-
172
-
173
-
174
-
175
-
176
-
177
-
178
-
179
-
180
-
181
-
182
-
183
-
184
-
185
-
186
-
187
-
188
-
189
-
190
-
191
-
192
-
193
-
194
-
195
-
196
-
197
-
198
-
199
-
200
-
201
-
202
-
203
-
204
-
205
-
206
-
207
-
208
-
209
-
210
-
211
-
212
-
213
-
214
-
215
-
216
-
217
-
218
-
219
-
220
-
221
-
222
-
223
-
224
-
225
-
226
-
227
-
228
-
229
-
230
-
231
-
232
-
233
-
234
-
235
-
236
-
237
-
238
-
239
-
240
-
241
-
242
-
243
-
244
-
245
-
246
-
247
-
248
-
249
-
250
-
251
-
252
-
253
-
254
-
255
-
256
-
257
-
258
-
259
-
260
-
261
-
262
-
263
-
264
-
265
-
266
-
267
-
268
-
269
-
270
-
271
-
272
-
273
-
274
-
275
-
276
-
277
-
278
-
279
-
280
-
281
-
282
-
283
-
284
-
285
-
286
-
287
-
288
-
289
-
290
-
291
-
292
-
293
-
294
-
295
-
296
-
297
-
298
-
299
-
300
-
301
-
302
-
303
-
304
-
305
-
306
-
307
-
308
-
309
-
310
-
311
-
312
-
313
-
314
-
315
-
316
-
317
-
318
-
319
-
320
-
321
-
322
-
323
-
324
-
325
-
326
-
327
-
328
-
329
-
330
-
331
-
332
-
333
-
334
-
335
-
336
-
337
-
338
-
339
-
340
-
341
-
342
-
343
-
344
-
345
-
346
-
347
-
348
-
349
-
350
-
351
 |
 |

Table of Contents
Comcast 2010 Annual Report on Form 10-K
40
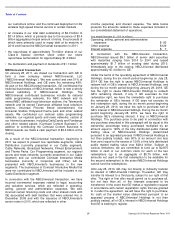
Cable Segment Revenue
Our average monthly total revenue per video customer
increased to approximately $129 in 2010 from approximately
$118 in 2009 and approximately $111 in 2008. The increases
in average monthly total revenue per video customer are
primarily due to increases in the number of customers
receiving multiple services, rate adjustments, contributions
from business services and advertising revenue.
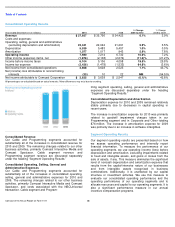
Video
We offer video services ranging from a limited analog service
to a full digital service with access to hundreds of channels,
including premium and pay-per-view channels. As of
December 31, 2010, approximately 44% of the homes in the
areas we serve subscribed to our video services. As of
December 31, 2010, 87% of those video customers
subscribed to at least one of our digital video services,
compared to 78% and 70% as of December 31, 2009 and
2008, respectively. Digital video customers may also
subscribe to our advanced services, HDTV and DVR. As of
December 31, 2010, approximately 51% of our digital video
customers subscribed to at least one of our advanced
services.
Our video revenue continued to grow in 2010 and 2009 due
to rate adjustments and customer upgrades to our digital and
advanced services, which were offset by declines in the
number of analog residential video customers in both years.
During 2010 and 2009, the number of video customers
decreased by approximately 757,000 and 623,000,
respectively. These decreases were primarily due to the loss
of customers upon expiration of discounted promotions in
2010, competitive pressures in our service areas and
weakness in the economy. We expect further declines in the
number of residential video customers during 2011 for similar
reasons. During 2010 and 2009, we added or upgraded to
our digital video service approximately 1.3 million customers
and 1.4 million customers, respectively, including those
customers added or upgraded in connection with our all
digital conversion.
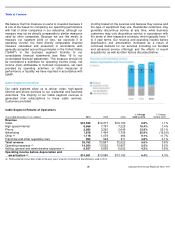
High-Speed Internet
We offer high-speed Internet services with Internet access at
downstream speeds of up to 105 Mbps, depending on the
service selected and subject to geographic market
availability. These services also include our Internet portal,
Comcast.net, which provides multiple e-mail addresses and
online storage, as well as a variety of content and features
and enhancements that are designed to take advantage of
the speed of the Internet services we provide. Our high-
speed Internet service for business customers also includes
a website hosting service and an online tool that allows
customers to share, coordinate and store documents. As of
December 31, 2010, 33% of the homes in the areas we serve
subscribed to our high-speed Internet services, compared to
31% and 30% as of December 31, 2009 and 2008,
respectively. Our high-speed Internet revenue increased in
2010 and 2009 primarily due to increases in the number of
residential and business
customers and, in 2010, due to rate adjustments. During
2010 and 2009, we added approximately 1.1 million and
1.0 million high-speed Internet customers, respectively.
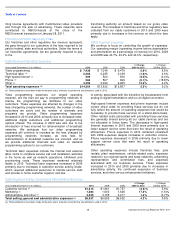
Phone
We offer phone services that provide local and long-distance
calling and include features such as voice mail, caller ID and
call waiting. Our phone service for business customers also
includes a business directory listing and the option to add
multiple phone lines. As of December 31, 2010, our phone
services were available to substantially all of the homes in
the areas we serve. As of December 31, 2010, approximately
17% of the homes in the areas we serve subscribed to our
phone services, compared to 16% and 14% as of
December 31, 2009 and 2008, respectively. Our phone
revenue increased in 2010 and 2009 primarily due to
increases in the number of residential and business
customers. During 2010 and 2009, we added approximately
988,000 and 1.1 million phone customers, respectively.
Advertising
As part of our programming license agreements with
programming networks, we generally receive an allocation of
scheduled advertising time that we may sell to local, regional
and national advertisers. In most cases, the available
advertising time is sold by our sales force. In some cases, we
work with representation firms as an extension of our sales
force to sell a portion of the advertising time allocated to us.
We also coordinate the advertising sales efforts of other
cable operators in some markets, and in some markets we
operate advertising interconnects. These interconnects
establish a physical, direct link among multiple providers for
the sale of regional and national advertising across larger
geographic areas than could be provided by a single cable
operator.
Advertising revenue increased in 2010 primarily due to
improvements in the overall television advertising market,
including political advertising. Advertising revenue decreased
in 2009 primarily due to a decline in the overall television
advertising market as a result of weak economic conditions
and a decline in political advertising.
Other
We also generate revenue from our regional sports and news
networks, our digital media center, commissions from
electronic retailing networks and fees from other services.
Our regional sports and news networks include Comcast
SportsNet (Philadelphia), Comcast SportsNet Mid-Atlantic
(Baltimore/Washington), Cable Sports Southeast, Comcast
SportsNet Chicago, MountainWest Sports Network, Comcast
SportsNet California (Sacramento), Comcast SportsNet New
England (Boston), Comcast SportsNet Northwest (Portland),
Comcast Sports Southwest (Houston), Comcast SportsNet
Bay Area (San Francisco), New England Cable News
(Boston), Comcast Network Philadelphia and Comcast
Network Mid-Atlantic (Baltimore/Washington). These
networks generate revenue from program-