Comcast 2010 Annual Report Download - page 63
Download and view the complete annual report
Please find page 63 of the 2010 Comcast annual report below. You can navigate through the pages in the report by either clicking on the pages listed below, or by using the keyword search tool below to find specific information within the annual report.-
 1
1 -
2
-
3
-
4
-
5
-
6
-
7
-
8
-
9
-
10
-
11
-
12
-
13
-
14
-
15
-
16
-
17
-
18
-
19
-
20
-
21
-
22
-
23
-
24
-
25
-
26
-
27
-
28
-
29
-
30
-
31
-
32
-
33
-
34
-
35
-
36
-
37
-
38
-
39
-
40
-
41
-
42
-
43
-
44
-
45
-
46
-
47
-
48
-
49
-
50
-
51
-
52
-
 53
53 -
 54
54 -
 55
55 -
 56
56 -
 57
57 -
 58
58 -
 59
59 -
 60
60 -
 61
61 -
 62
62 -
 63
63 -
 64
64 -
 65
65 -
 66
66 -
 67
67 -
 68
68 -
 69
69 -
 70
70 -
 71
71 -
 72
72 -
 73
73 -
74
-
75
-
76
-
77
-
78
-
79
-
80
-
81
-
82
-
83
-
84
-
85
-
86
-
87
-
88
-
89
-
90
-
91
-
92
-
93
-
94
-
95
-
96
-
97
-
98
-
99
-
100
-
101
-
102
-
103
-
104
-
105
-
106
-
107
-
108
-
109
-
110
-
111
-
112
-
113
-
114
-
115
-
116
-
117
-
118
-
119
-
120
-
121
-
122
-
123
-
124
-
125
-
126
-
127
-
128
-
129
-
130
-
131
-
132
-
133
-
134
-
135
-
136
-
137
-
138
-
139
-
140
-
141
-
142
-
143
-
144
-
145
-
146
-
147
-
148
-
149
-
150
-
151
-
152
-
153
-
154
-
155
-
156
-
157
-
158
-
159
-
160
-
161
-
162
-
163
-
164
-
165
-
166
-
167
-
168
-
169
-
170
-
171
-
172
-
173
-
174
-
175
-
176
-
177
-
178
-
179
-
180
-
181
-
182
-
183
-
184
-
185
-
186
-
187
-
188
-
189
-
190
-
191
-
192
-
193
-
194
-
195
-
196
-
197
-
198
-
199
-
200
-
201
-
202
-
203
-
204
-
205
-
206
-
207
-
208
-
209
-
210
-
211
-
212
-
213
-
214
-
215
-
216
-
217
-
218
-
219
-
220
-
221
-
222
-
223
-
224
-
225
-
226
-
227
-
228
-
229
-
230
-
231
-
232
-
233
-
234
-
235
-
236
-
237
-
238
-
239
-
240
-
241
-
242
-
243
-
244
-
245
-
246
-
247
-
248
-
249
-
250
-
251
-
252
-
253
-
254
-
255
-
256
-
257
-
258
-
259
-
260
-
261
-
262
-
263
-
264
-
265
-
266
-
267
-
268
-
269
-
270
-
271
-
272
-
273
-
274
-
275
-
276
-
277
-
278
-
279
-
280
-
281
-
282
-
283
-
284
-
285
-
286
-
287
-
288
-
289
-
290
-
291
-
292
-
293
-
294
-
295
-
296
-
297
-
298
-
299
-
300
-
301
-
302
-
303
-
304
-
305
-
306
-
307
-
308
-
309
-
310
-
311
-
312
-
313
-
314
-
315
-
316
-
317
-
318
-
319
-
320
-
321
-
322
-
323
-
324
-
325
-
326
-
327
-
328
-
329
-
330
-
331
-
332
-
333
-
334
-
335
-
336
-
337
-
338
-
339
-
340
-
341
-
342
-
343
-
344
-
345
-
346
-
347
-
348
-
349
-
350
-
351
 |
 |

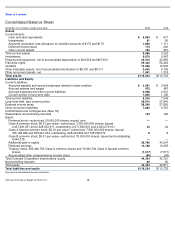
Table of Contents
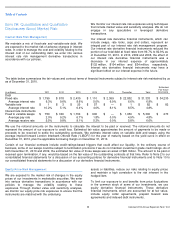
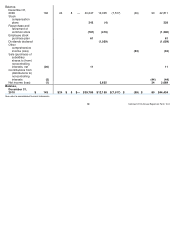
Consolidated Balance Sheet
See notes to consolidated financial statements.
December 31 (in millions, except share data)
2010
2009
Assets
Current Assets:
Cash and cash equivalents
$
5,984
$
671
Investments
81
50
Accounts receivable, less allowance for doubtful accounts of $173 and $175
1,855
1,711
Deferred income taxes
174
240
Other current assets
792
551
Total current assets
8,886
3,223
Investments
6,670
5,947
Property and equipment, net of accumulated depreciation of $32,505 and $27,810
23,515
23,855
Franchise rights
59,442
59,452
Goodwill
14,958
14,933
Other intangible assets, net of accumulated amortization of $9,791 and $8,711
3,602
4,105
Other noncurrent assets, net
1,461
1,218
Total assets
$
118,534
$
112,733
Liabilities and Equity
Current Liabilities:
Accounts payable and accrued expenses related to trade creditors
$
3,291
$
3,094
Accrued salaries and wages
475
487
Accrued expenses and other current liabilities
2,668
2,512
Current portion of long-term debt
1,800
1,156
Total current liabilities
8,234
7,249
Long
-
term debt, less current portion
29,615
27,940
Deferred income taxes
28,246
27,800
Other noncurrent liabilities
7,862
6,767
Commitments and contingencies (Note 18)
Redeemable noncontrolling interests
143
166
Equity:
Preferred stock
—
authorized, 20,000,000 shares; issued, zero
—
—
Class A common stock, $0.01 par value—authorized, 7,500,000,000 shares; issued,
2,437,281,651 and 2,428,533,911; outstanding, 2,071,820,901 and 2,063,073,161
24
24
Class A Special common stock, $0.01 par value—authorized, 7,500,000,000 shares; issued,
766,168,658 and 835,991,034; outstanding, 695,233,894 and 765,056,270
8
8
Class B common stock, $0.01 par value—authorized, 75,000,000 shares; issued and outstanding,
9,444,375
—
—
Additional paid
-
in capital
39,780
40,247
Retained earnings
12,158
10,005
Treasury stock, 365,460,750 Class A common shares and 70,934,764 Class A Special common
shares
(7,517
)
(7,517
)
Accumulated other comprehensive income (loss)
(99
)
(46
)
Total Comcast Corporation shareholders
’
equity
44,354
42,721
Noncontrolling interests
80
90
Total equity
44,434
42,811
Total liabilities and equity
$
118,534
$
112,733
Comcast 2010 Annual Report on Form 10-K
56