Comcast 2010 Annual Report Download - page 50
Download and view the complete annual report
Please find page 50 of the 2010 Comcast annual report below. You can navigate through the pages in the report by either clicking on the pages listed below, or by using the keyword search tool below to find specific information within the annual report.-
 1
1 -
2
-
3
-
4
-
5
-
6
-
7
-
8
-
9
-
10
-
11
-
12
-
13
-
14
-
15
-
16
-
17
-
18
-
19
-
20
-
21
-
22
-
23
-
24
-
25
-
26
-
27
-
28
-
29
-
30
-
31
-
32
-
33
-
34
-
35
-
36
-
37
-
38
-
39
-
 40
40 -
 41
41 -
 42
42 -
 43
43 -
 44
44 -
 45
45 -
 46
46 -
 47
47 -
 48
48 -
 49
49 -
 50
50 -
 51
51 -
 52
52 -
 53
53 -
 54
54 -
 55
55 -
 56
56 -
 57
57 -
 58
58 -
 59
59 -
 60
60 -
61
-
62
-
63
-
64
-
65
-
66
-
67
-
68
-
69
-
70
-
71
-
72
-
73
-
74
-
75
-
76
-
77
-
78
-
79
-
80
-
81
-
82
-
83
-
84
-
85
-
86
-
87
-
88
-
89
-
90
-
91
-
92
-
93
-
94
-
95
-
96
-
97
-
98
-
99
-
100
-
101
-
102
-
103
-
104
-
105
-
106
-
107
-
108
-
109
-
110
-
111
-
112
-
113
-
114
-
115
-
116
-
117
-
118
-
119
-
120
-
121
-
122
-
123
-
124
-
125
-
126
-
127
-
128
-
129
-
130
-
131
-
132
-
133
-
134
-
135
-
136
-
137
-
138
-
139
-
140
-
141
-
142
-
143
-
144
-
145
-
146
-
147
-
148
-
149
-
150
-
151
-
152
-
153
-
154
-
155
-
156
-
157
-
158
-
159
-
160
-
161
-
162
-
163
-
164
-
165
-
166
-
167
-
168
-
169
-
170
-
171
-
172
-
173
-
174
-
175
-
176
-
177
-
178
-
179
-
180
-
181
-
182
-
183
-
184
-
185
-
186
-
187
-
188
-
189
-
190
-
191
-
192
-
193
-
194
-
195
-
196
-
197
-
198
-
199
-
200
-
201
-
202
-
203
-
204
-
205
-
206
-
207
-
208
-
209
-
210
-
211
-
212
-
213
-
214
-
215
-
216
-
217
-
218
-
219
-
220
-
221
-
222
-
223
-
224
-
225
-
226
-
227
-
228
-
229
-
230
-
231
-
232
-
233
-
234
-
235
-
236
-
237
-
238
-
239
-
240
-
241
-
242
-
243
-
244
-
245
-
246
-
247
-
248
-
249
-
250
-
251
-
252
-
253
-
254
-
255
-
256
-
257
-
258
-
259
-
260
-
261
-
262
-
263
-
264
-
265
-
266
-
267
-
268
-
269
-
270
-
271
-
272
-
273
-
274
-
275
-
276
-
277
-
278
-
279
-
280
-
281
-
282
-
283
-
284
-
285
-
286
-
287
-
288
-
289
-
290
-
291
-
292
-
293
-
294
-
295
-
296
-
297
-
298
-
299
-
300
-
301
-
302
-
303
-
304
-
305
-
306
-
307
-
308
-
309
-
310
-
311
-
312
-
313
-
314
-
315
-
316
-
317
-
318
-
319
-
320
-
321
-
322
-
323
-
324
-
325
-
326
-
327
-
328
-
329
-
330
-
331
-
332
-
333
-
334
-
335
-
336
-
337
-
338
-
339
-
340
-
341
-
342
-
343
-
344
-
345
-
346
-
347
-
348
-
349
-
350
-
351
 |
 |

Table of Contents
Comcast 2010 Annual Report on Form 10-K
44
We anticipate that we will continue to use a substantial
portion of our cash flows to fund our capital expenditures, to
invest in business opportunities, to meet our debt repayment
obligations and to return capital to shareholders.
We traditionally maintain significant availability under our
lines of credit and our commercial paper program to meet our
short-term liquidity requirements. As of December 31, 2010,
amounts available under all of our credit facilities totaled
approximately $6.4 billion. As of the closing of the
NBCUniversal transaction on January 28, 2011,
NBCUniversal had a $750 million three-year revolving credit
facility.
We and our Cable subsidiaries that have provided
guarantees are subject to the covenants and restrictions set
forth in the indentures governing our public debt securities
and in the credit agreements governing our bank credit
facilities (see Note 22 to our consolidated financial
statements). We and the guarantors are in compliance with
the covenants, and we believe that neither the covenants nor
the restrictions in our indentures or loan documents will limit
our ability to operate our businesses or raise additional
capital. We test our compliance with our credit facilities’
covenants on an ongoing basis. The only financial covenant
in our $6.8 billion revolving credit facility due 2013 pertains to
leverage (ratio of debt to operating income before
depreciation and amortization). As of December 31, 2010, we
met this financial covenant by a significant margin. We do not
expect to have to further reduce debt or improve operating
results in order to continue to comply with this financial
covenant.
In connection with the NBCUniversal transaction, we were
required to make a cash payment of $6.2 billion. We funded
this payment with cash on hand and $650 million of
commercial paper borrowings. The cash paid will be adjusted
after the close to reflect final balances of certain working
capital accounts and other closing adjustments. The
transaction also calls for the payment to GE, in the future, of
certain tax benefits to the extent realized by us. Beginning in
2011, we will consolidate $9.1 billion of NBCUniversal senior
debt securities with maturities ranging from 2014 to 2041. We
do not guarantee NBCUniversal’s debt obligations. Any future
redemptions of GE’s stake in NBCUniversal Holdings are
expected to be funded primarily through NBCUniversal’s
cash flows from operating activities and its borrowing
capacity. If any borrowings by NBCUniversal to fund either of
GE’s two potential redemptions would result in NBCUniversal
exceeding a certain leverage ratio or losing investment grade
status or if it cannot otherwise fund such redemptions, we are
committed to fund up to $2.875 billion in cash or our common
stock for each of the two potential redemptions (for an
aggregate of up to $5.75 billion, with amounts not used in the
first redemption to be available for the second redemption) to
the extent NBCUniversal Holdings cannot fund the
redemptions.
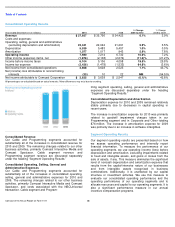
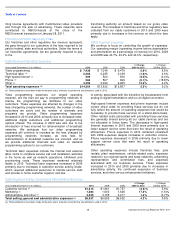
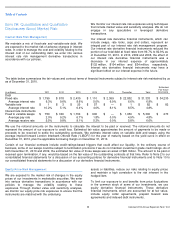
Operating Activities
Components of Net Cash Provided by Operating Activities
The changes in operating assets and liabilities in 2010 and
2009 primarily relate to the timing of payments of operating
items and payroll. In 2009, there was a significant reduction
in accrued liabilities due to a payroll period occurring at the
end of the year.
The decrease in interest payments in 2010 was primarily due
to the effects of early extinguishment costs associated with
the repayment of our debt obligations in connection with a
cash tender offer in July 2009. The decrease in interest
payments in 2009 was primarily due to decreases in interest
rates on debt subject to variable interest rate swap
agreements, the effects of our debt repayments and the
maturity of certain higher rate debt in 2008.
The increase in income tax payments in 2010 was primarily
due to increases in 2010 taxable income, partially offset by
tax payments made in 2009 that related to prior years. The
increase in income tax payments in 2009 was primarily due
to increases in 2009 taxable income, the settlements of
uncertain tax positions and a tax payment made in 2009 that
related to 2008, partially offset by the net benefits of
approximately $341 million from the 2008 and 2009
economic stimulus legislation.
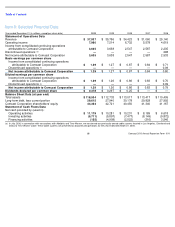
Year ended December 31 (in millions)
2010
2009
2008
Operating income
$
7,980
$
7,214
$
6,732
Depreciation and
amortization
6,616
6,500
6,400
Operating income
before depreciation
and amortization
14,596
13,714
13,132
Noncash share-based
compensation
300
257
258
Changes in operating
assets and liabilities
(20
)
(450
)
(251
)
Cash basis operating
income
14,876
13,521
13,139
Payments of interest
(1,983
)
(2,040
)
(2,256
)
Payments of income taxes
(1,864
)
(1,303
)
(762
)
Proceeds from interest,
dividends and other
nonoperating items
154
103
125
Excess tax benefit under
share-based
compensation presented
in financing activities
(4
)
—
(
15
)
Net cash provided by
operating activities
$
11,179
$
10,281
$
10,231