Comcast 2010 Annual Report Download - page 47
Download and view the complete annual report
Please find page 47 of the 2010 Comcast annual report below. You can navigate through the pages in the report by either clicking on the pages listed below, or by using the keyword search tool below to find specific information within the annual report.-
 1
1 -
2
-
3
-
4
-
5
-
6
-
7
-
8
-
9
-
10
-
11
-
12
-
13
-
14
-
15
-
16
-
17
-
18
-
19
-
20
-
21
-
22
-
23
-
24
-
25
-
26
-
27
-
28
-
29
-
30
-
31
-
32
-
33
-
34
-
35
-
36
-
 37
37 -
 38
38 -
 39
39 -
 40
40 -
 41
41 -
 42
42 -
 43
43 -
 44
44 -
 45
45 -
 46
46 -
 47
47 -
 48
48 -
 49
49 -
 50
50 -
 51
51 -
 52
52 -
 53
53 -
 54
54 -
 55
55 -
 56
56 -
 57
57 -
58
-
59
-
60
-
61
-
62
-
63
-
64
-
65
-
66
-
67
-
68
-
69
-
70
-
71
-
72
-
73
-
74
-
75
-
76
-
77
-
78
-
79
-
80
-
81
-
82
-
83
-
84
-
85
-
86
-
87
-
88
-
89
-
90
-
91
-
92
-
93
-
94
-
95
-
96
-
97
-
98
-
99
-
100
-
101
-
102
-
103
-
104
-
105
-
106
-
107
-
108
-
109
-
110
-
111
-
112
-
113
-
114
-
115
-
116
-
117
-
118
-
119
-
120
-
121
-
122
-
123
-
124
-
125
-
126
-
127
-
128
-
129
-
130
-
131
-
132
-
133
-
134
-
135
-
136
-
137
-
138
-
139
-
140
-
141
-
142
-
143
-
144
-
145
-
146
-
147
-
148
-
149
-
150
-
151
-
152
-
153
-
154
-
155
-
156
-
157
-
158
-
159
-
160
-
161
-
162
-
163
-
164
-
165
-
166
-
167
-
168
-
169
-
170
-
171
-
172
-
173
-
174
-
175
-
176
-
177
-
178
-
179
-
180
-
181
-
182
-
183
-
184
-
185
-
186
-
187
-
188
-
189
-
190
-
191
-
192
-
193
-
194
-
195
-
196
-
197
-
198
-
199
-
200
-
201
-
202
-
203
-
204
-
205
-
206
-
207
-
208
-
209
-
210
-
211
-
212
-
213
-
214
-
215
-
216
-
217
-
218
-
219
-
220
-
221
-
222
-
223
-
224
-
225
-
226
-
227
-
228
-
229
-
230
-
231
-
232
-
233
-
234
-
235
-
236
-
237
-
238
-
239
-
240
-
241
-
242
-
243
-
244
-
245
-
246
-
247
-
248
-
249
-
250
-
251
-
252
-
253
-
254
-
255
-
256
-
257
-
258
-
259
-
260
-
261
-
262
-
263
-
264
-
265
-
266
-
267
-
268
-
269
-
270
-
271
-
272
-
273
-
274
-
275
-
276
-
277
-
278
-
279
-
280
-
281
-
282
-
283
-
284
-
285
-
286
-
287
-
288
-
289
-
290
-
291
-
292
-
293
-
294
-
295
-
296
-
297
-
298
-
299
-
300
-
301
-
302
-
303
-
304
-
305
-
306
-
307
-
308
-
309
-
310
-
311
-
312
-
313
-
314
-
315
-
316
-
317
-
318
-
319
-
320
-
321
-
322
-
323
-
324
-
325
-
326
-
327
-
328
-
329
-
330
-
331
-
332
-
333
-
334
-
335
-
336
-
337
-
338
-
339
-
340
-
341
-
342
-
343
-
344
-
345
-
346
-
347
-
348
-
349
-
350
-
351
 |
 |

Table of Contents
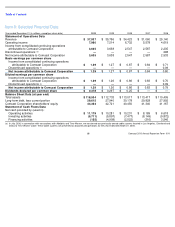
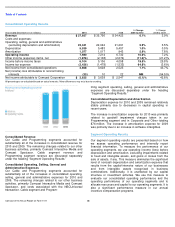
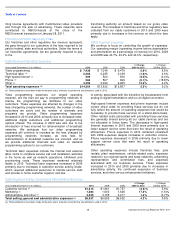
Cable Segment Operating Expenses
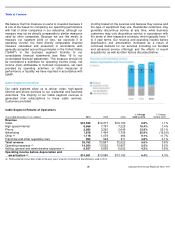
Cable Segment Selling, General and Administrative Expenses
Year ended December 31 (in millions)
2010
2009
2008
% Change
2009 to 2010
% Change
2008 to 2009
Video programming
$
7,438
$
7,046
$
6,479
5.6
%
8.8
%
Technical labor
2,263
2,295
2,188
(1.4
)%
4.9
%
High-speed Internet
499
524
526
(4.9
)%
(0.4
)%
Phone
566
567
699
(0.1
)%
(18.8
)%
Other
3,498
3,090
2,965
13.3
%
4.2
%
Total operating expenses
$
14,264
$
13,522
$
12,857
5.5
%
5.2
%
(a)
Reclassifications have been made to the prior years’ amounts to conform to classifications used in 2010.
Year ended December 31 (in millions)
2010
2009
2008
% Change
2009 to 2010
% Change
2008 to 2009
Customer service
$
1,815
$
1,861
$
1,757
(2.5
)%
5.9
%
Marketing
1,883
1,603
1,628
17.4
%
(1.6
)%
Administrative and other
3,239
3,195
3,217
1.4
%
(0.7
)%
Total selling, general and administrative expenses
$
6,937
$
6,659
$
6,602
4.2
%
0.8
%
(a)
Reclassifications have been made to the prior years’ amounts to conform to classifications used in 2010.
41
Comcast 2010 Annual Report on Form 10-
K
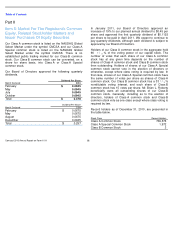
ming license agreements with multichannel video providers
and through the sale of advertising. These networks were
contributed to NBCUniversal at the close of the
NBCUniversal transaction on January 28, 2011.
Franchise and Other Regulatory Fees
Our franchise and other regulatory fee revenue represents
the pass-through to our customers of the fees required to be
paid to federal, state and local authorities. Under the terms of
our franchise agreements, we are generally required to pay
to the
franchising authority an amount based on our gross video
revenue. The increases in franchise and other regulatory fees
collected from our cable customers in 2010 and 2009 were
primarily due to increases in the revenue on which the fees
apply.
Cable Segment Expenses
We continue to focus on controlling the growth of expenses.
Our operating margin (operating income before depreciation
and amortization as a percentage of revenue) for 2010, 2009
and 2008 was 40.7%, 40.4% and 40.3%, respectively.
(a)
(a)
(a)
(a)
(a)
Video programming expenses, our largest operating
expense, are the fees we pay to programming networks to
license the programming we distribute to our video
customers. These expenses are affected by changes in the
fees charged by programming networks, the number of video
customers we serve and the number of channels and
programs we provide. Video programming expenses
increased in 2010 and 2009, primarily due to increased rates,
additional digital customers and additional programming
options offered. The increase in 2009 was also due to the
introduction of fees incurred for retransmission of broadcast
networks. We anticipate that our video programming
expenses will continue to increase as the fees charged by
programming networks increase, as new fees for
retransmission of broadcast networks are incurred, and as
we provide additional channels and video on demand
programming options to our customers.
Technical labor expenses include the internal and external
labor costs to complete service call and installation activities
in the home as well as network operations, fulfillment and
provisioning costs. These expenses remained relatively
stable in 2010. Technical labor expenses increased in 2009
primarily due to increases in customer service activity levels,
which required additional personnel to handle service calls
and provide in-home customer support, and due
to activity associated with the transition by broadcasters from
analog to digital transmission and our all digital conversion.
High-speed Internet expenses and phone expenses include
certain direct costs for providing these services but do not
fully reflect the amount of operating expenses that would be
necessary to provide these services on a stand-alone basis.
Other related costs associated with providing these services
are generally shared among all our cable services and are
not allocated to these items. The decreases in high-speed
Internet expenses in 2010 and 2009 were primarily due to
lower support service costs that were the result of operating
efficiencies. Phone expenses in 2010 remained consistent
with 2009 expenses despite increases in customer volume.
Phone expenses decreased in 2009 primarily due to lower
support service costs that were the result of operating
efficiencies.
Other operating expenses include franchise fees, pole
rentals, plant maintenance, vehicle-related costs, expenses
related to our regional sports and news networks, advertising
representation and commission fees, and expenses
associated with our business services. These expenses
increased in 2010 and 2009 primarily due to increases in
advertising activity, the continued expansion of business
services, and other service enhancement initiatives.
(a)
(a)
(a)
(a)