Comcast 2010 Annual Report Download - page 87
Download and view the complete annual report
Please find page 87 of the 2010 Comcast annual report below. You can navigate through the pages in the report by either clicking on the pages listed below, or by using the keyword search tool below to find specific information within the annual report.-
 1
1 -
2
-
3
-
4
-
5
-
6
-
7
-
8
-
9
-
10
-
11
-
12
-
13
-
14
-
15
-
16
-
17
-
18
-
19
-
20
-
21
-
22
-
23
-
24
-
25
-
26
-
27
-
28
-
29
-
30
-
31
-
32
-
33
-
34
-
35
-
36
-
37
-
38
-
39
-
40
-
41
-
42
-
43
-
44
-
45
-
46
-
47
-
48
-
49
-
50
-
51
-
52
-
53
-
54
-
55
-
56
-
57
-
58
-
59
-
60
-
61
-
62
-
63
-
64
-
65
-
66
-
67
-
68
-
69
-
70
-
71
-
72
-
73
-
74
-
75
-
76
-
 77
77 -
 78
78 -
 79
79 -
 80
80 -
 81
81 -
 82
82 -
 83
83 -
 84
84 -
 85
85 -
 86
86 -
 87
87 -
 88
88 -
 89
89 -
 90
90 -
 91
91 -
 92
92 -
 93
93 -
 94
94 -
 95
95 -
 96
96 -
 97
97 -
98
-
99
-
100
-
101
-
102
-
103
-
104
-
105
-
106
-
107
-
108
-
109
-
110
-
111
-
112
-
113
-
114
-
115
-
116
-
117
-
118
-
119
-
120
-
121
-
122
-
123
-
124
-
125
-
126
-
127
-
128
-
129
-
130
-
131
-
132
-
133
-
134
-
135
-
136
-
137
-
138
-
139
-
140
-
141
-
142
-
143
-
144
-
145
-
146
-
147
-
148
-
149
-
150
-
151
-
152
-
153
-
154
-
155
-
156
-
157
-
158
-
159
-
160
-
161
-
162
-
163
-
164
-
165
-
166
-
167
-
168
-
169
-
170
-
171
-
172
-
173
-
174
-
175
-
176
-
177
-
178
-
179
-
180
-
181
-
182
-
183
-
184
-
185
-
186
-
187
-
188
-
189
-
190
-
191
-
192
-
193
-
194
-
195
-
196
-
197
-
198
-
199
-
200
-
201
-
202
-
203
-
204
-
205
-
206
-
207
-
208
-
209
-
210
-
211
-
212
-
213
-
214
-
215
-
216
-
217
-
218
-
219
-
220
-
221
-
222
-
223
-
224
-
225
-
226
-
227
-
228
-
229
-
230
-
231
-
232
-
233
-
234
-
235
-
236
-
237
-
238
-
239
-
240
-
241
-
242
-
243
-
244
-
245
-
246
-
247
-
248
-
249
-
250
-
251
-
252
-
253
-
254
-
255
-
256
-
257
-
258
-
259
-
260
-
261
-
262
-
263
-
264
-
265
-
266
-
267
-
268
-
269
-
270
-
271
-
272
-
273
-
274
-
275
-
276
-
277
-
278
-
279
-
280
-
281
-
282
-
283
-
284
-
285
-
286
-
287
-
288
-
289
-
290
-
291
-
292
-
293
-
294
-
295
-
296
-
297
-
298
-
299
-
300
-
301
-
302
-
303
-
304
-
305
-
306
-
307
-
308
-
309
-
310
-
311
-
312
-
313
-
314
-
315
-
316
-
317
-
318
-
319
-
320
-
321
-
322
-
323
-
324
-
325
-
326
-
327
-
328
-
329
-
330
-
331
-
332
-
333
-
334
-
335
-
336
-
337
-
338
-
339
-
340
-
341
-
342
-
343
-
344
-
345
-
346
-
347
-
348
-
349
-
350
-
351
 |
 |

Table of Contents
77
Comcast 2010 Annual Report on Form 10-
K
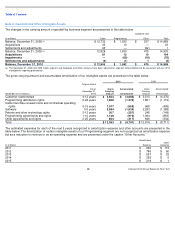
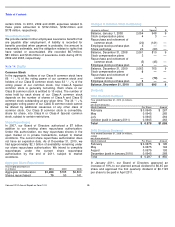
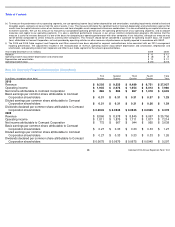
Accumulated Other Comprehensive Income (Loss)
The table below presents the components of our
accumulated other comprehensive income (loss), net of
deferred taxes.
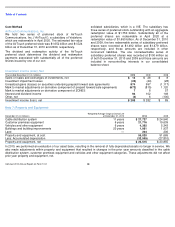
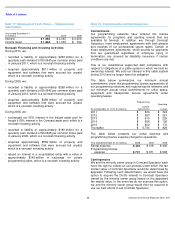
Note 15: Share-Based Compensation
Our approach to long-term incentive compensation includes
the awarding of stock options and RSUs to certain
employees and directors. We grant these awards under
various plans. Additionally, through our employee stock
purchase plan, employees are able to purchase shares of
Comcast Class A common stock at a discount through payroll
deductions.
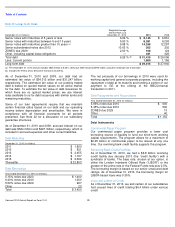
Recognized Share-Based Compensation Expense
As of December 31, 2010, we had unrecognized pretax
compensation expense of $288 million related to nonvested
stock options and unrecognized pretax compensation
expense of $286 million related to nonvested RSUs that will
be recognized over a weighted average period of
approximately 2.2 years and 1.7 years, respectively. The
amount of share-based compensation capitalized was not
material to our consolidated financial statements for the
periods presented.
When stock options are exercised or RSU awards are settled
through the issuance of shares, any income tax benefit
realized in excess of the amount associated with
compensation expense that was previously recognized for
financial reporting purposes is presented as a financing
activity rather than as an operating activity in our
consolidated statement of cash flows. The excess cash
income tax benefit classified as a financing cash inflow was
approximately $4 million and $15 million in 2010 and 2008,
respectively. There was no excess cash income tax benefit
classified as a financing cash inflow in 2009.
December 31 (in millions)
2010
2009
Unrealized gains (losses) on
marketable securities
$
26
$
22
Deferred gains (losses) on cash
flow hedges
(105
)
(62
)
Unrecognized gains (losses) on
employee benefit obligations
(19
)
(6
)
Cumulative translation adjustments
(1
)
—
Accumulated other comprehensive
income (loss), net of deferred
taxes
$
(99
)
$
(46
)
Year ended December 31
(in millions)
2010
2009
2008
Stock options
$
103
$
103
$
99
Restricted share units
136
93
96
Employee stock purchase
plan
12
13
13
Total
$
251
$
209
$
208
Tax benefit
$
89
$
73
$
71
Option Plans
We maintain stock option plans for certain employees under
which fixed
-price stock options may be granted and the
option price is generally not less than the fair value of a share
of the underlying stock at the date of grant. Under our stock
option plans, a combined total of approximately 223 million
shares of our Class A and Class A Special common stock are
reserved for the exercise of stock options, including those
outstanding as of December 31, 2010. Option terms are
generally 10 years, with options generally becoming
exercisable within 5 years from the date of grant.
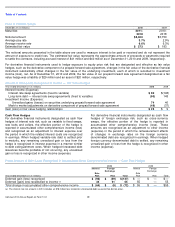
We use the Black-Scholes option pricing model to estimate
the fair value of each stock option on the date of grant. The
Black-Scholes option pricing model uses the assumptions
summarized in the table below. Dividend yield is based on
the yield at the date of grant. Expected volatility is based on a
blend of implied and historical volatility of our Class A
common stock. The risk-free rate is based on the U.S.
Treasury yield curve in effect at the date of grant. We use
historical data on the exercise of stock options and other
factors expected to impact holders’ behavior to estimate the
expected term of the options granted. The table below
summarizes the weighted-average fair values at the date of
grant of a Class A common stock option granted under our
stock option plans and the related weighted-average
valuation assumptions.
Stock Option Fair Value and Significant Assumptions
In 2007, we began granting net settled stock options instead
of stock options exercised with a cash payment (“cash settled
stock options”). In net settled stock options, an employee
receives the number of shares equal to the number of options
being exercised less the number of shares necessary to
satisfy the cost to exercise the options and, if applicable,
taxes due on exercise based on the fair value of the shares
at the exercise date. The change to net settled stock options
results in fewer shares being issued and no cash proceeds
being received by us when a net settled option is exercised.
Following the change in 2007, we offered employees the
opportunity to modify their outstanding stock options from
cash settled to net settled. The modifications that were made
did not result in any additional compensation expense.
2010
2009
2008
Fair value
$
5.11
$
4.93
$
6.47
Dividend yield
2.1
%
1.9
%
1.3
%
Expected volatility
28.0
%
36.8
%
32.8
%
Risk
-
free interest rate
3.4
%
2.4
%
3.0
%
Expected option life
(in years)
7.0
7.0
7.0